BMW 2009 Annual Report Download - page 35
Download and view the complete annual report
Please find page 35 of the 2009 BMW annual report below. You can navigate through the pages in the report by either clicking on the pages listed below, or by using the keyword search tool below to find specific information within the annual report.
33 Group Management Report
Eco-friendly transportation solutions
In 2009 we continued to work on ways of reducing the en-
vironmental impact of the logistics process. Efficiency was
raised by optimising transport networks, including the in-
creased capacity utilisation of the various modes of trans-
port. Shifts in sales volume by region, however, resulted in
changes in the proportion of goods transported by each
mode. At 0.2 %, the percentage of goods transported by
air remained very low during the year under report (2008:
0.1 %). The decline in sales volumes in the USA and Japan
slightly reduced the percentage of goods transported by
sea to 78.0 % (2008: 79.1 %). The proportion of goods
transported by rail fell slightly (by 0.3 percentage points) to
6.0 % in 2009. The percentage of goods transported by
road rose to 15.8 % (2008: 14.5 %) due to the small sales
volume increase in Germany.
Sales volume performance is also reflected in the distribu-
tion of transportation methods for our new cars: overall,
47.0 % of newly produced cars left the Group’s plants by
rail, 3.3 percentage points less than in the previous year.
Leader in CO2 reduction with Efficient Dynamics
At an early stage we adopted a development strategy
that
is now resulting in tangible benefits for the climate,
resources and customers alike. The centrepiece of these
activities is our Efficient Dynamics technology package.
Efficient Dynamics innovations have been introduced step
by step to all series models since March 2007, automatically
generating benefits with each unit sold. These include:
– optimised engine and drive train engineering (e. g. petrol
engines featuring High Precision Injection as well as
particularly efficient diesel engines)
– lightweight construction and improved aerodynamics
(e. g. through the intelligent use of aluminium and high-
tensile steels)
–
energy management (e. g. Brake Energy Regeneration
and the Auto Start Stop function)
Our main guiding principles throughout are: greater dyna-
mism, reduced fuel consumption and lower emissions.
These developments have enabled us to reduce the CO2
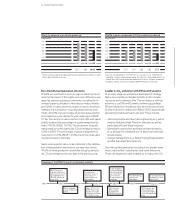
Volatile organic compounds (VOC) per vehicle produced
in kg / vehicle
2.75
2.50
2.25
2.00
1.75
1.50
05 06 07
* 08 09
2.07 2.04 2.36 1.96 1.77
* B
asis for data expanded in 2007 from ten to 17 locations. Until 2006: Munich,
Dingolfing, Landshut, Regensburg, Leipzig, Steyr, Rosslyn, Spartanburg, Hams Hall,
Oxford. Since 2007:
Berlin (brake disc production), Eisenach, Swindon, Goodwood,
Rayong (assembly), Chennai
(assembly) and BMW Brilliance in Shenyang.
Waste for disposal* per vehicle produced
in kg / vehicle
17.5
15.0
12.5
10.0
7.5
5.0
07 08 09
16.17 14.84 10.63
* “Waste for disposal per vehicle produced“ became a performance indicator in 2007
and has been reported since then.
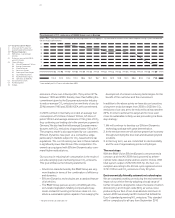
2005 2006 2007 2008 2009 2010 long-term
BMW Group cuts
fuel consumption in
Germany pursuant to
VDA agreement of
1990 by 2005 by al-
most 30 %.
BMW Hydrogen 7
is presented to the
public.
Introduction of
Efficient Dynamics
measures in nu-
merous BMW and
MINI models.
About 40 % of
the
BMW
Group’s
new
vehicles in Europe
emitting a maximum
of 140 g CO2/km.
More than one
million vehicles
equipped with
Efficient Dynamics.
A fleet of approxi-
mately 600 purely
electrically driven
cars, the MINI E,
put to the test
in everyday traffic
conditions.
BMW Group is pro-
viding vehicles for
sustainable mobility
in densely populated
areas.
First BMW Group
vehicles with
hybrid drive.
Use of regenerative
hydrogen as fuel in
motor traffic.
Roadmap of the BMW Group for sustainable mobility


