Atmos Energy 2015 Annual Report Download - page 15
Download and view the complete annual report
Please find page 15 of the 2015 Atmos Energy annual report below. You can navigate through the pages in the report by either clicking on the pages listed below, or by using the keyword search tool below to find specific information within the annual report.-
 1
1 -
2
-
3
-
4
-
 5
5 -
 6
6 -
 7
7 -
 8
8 -
 9
9 -
 10
10 -
 11
11 -
 12
12 -
 13
13 -
 14
14 -
 15
15 -
 16
16 -
 17
17 -
 18
18 -
 19
19 -
 20
20 -
 21
21
 |
 |

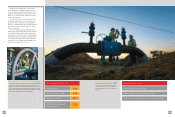
Atmos Energy at a Glance
Year Ended September 30 2015 2014
Meters in service
Residential 2,878,740 2,846,664
Commercial 262,655 258,404
Industrial 1,508 1,530
Public authority and other 8,409 8,471
Total meters 3,151,312 3,115,069
Heating degree days*
Actual (weighted average) 2,608 2,685
Percent of normal 98% 102%
Regulated distribution sales volumes (MMcf)
Residential 170,522 187,431
Commercial 100,323 105,074
Industrial 14,452 15,746
Public authority and other 8,053 9,069
Total 293,350 317,320
Regulated distribution transportation volumes (MMcf) 148,998 147,776
Total regulated distribution throughput (MMcf) 442,348 465,096
Intersegment activity (MMcf) (13,026) (13,293)
Consolidated regulated distribution throughput (MMcf) 429,322 451,803
Consolidated regulated pipeline transportation volumes (MMcf) 528,068 493,360
Consolidated nonregulated delivered gas sales volumes (MMcf) 351,427 377,441
Operating revenues (000s)
Regulated distribution sales revenues
Residential $ 1,761,689 $ 1,933,099
Commercial 772,187 876,042
Industrial 74,981 90,536
Public authority and other 53,401 64,779
Total regulated distribution sales revenues 2,662,258 2,964,456
Transportation revenues 67,475 64,049
Other gas revenues 27,852 27,707
Total regulated distribution revenues 2,757,585 3,056,212
Regulated pipeline revenues 97,662 92,166
Nonregulated revenues 1,286,889 1,792,538
Total operating revenues (000s) $ 4,142,136 $ 4,940,916
Other statistics
Gross plant (000s) $ 9,240,100 $ 8,447,700
Net plant (000s) $ 7,430,580 $ 6,725,906
Miles of pipe 75,806 73,248
Employees 4,753 4,761
*Heating degree days are adjusted for service areas with weather-normalized operations.
Condensed Consolidated Balance Sheets
Year Ended September 30 — Dollars in thousands, except share data 2015 2014
Assets
Property, plant and equipment $ 8,959,702 $ 8,200,121
Construction in progress 280,398 247,579
9,240,100 8,447,700
Less accumulated depreciation and amortization 1,809,520 1,721,794
Net property, plant and equipment 7,430,580 6,725,906
Current assets
Cash and cash equivalents 28,653 42,258
Accounts receivable, less allowance for doubtful accounts of
$15,283 in 2015 and $23,992 in 2014 295,160 343,400
Gas stored underground 236,603 278,917
Other current assets 70,569 111,265
Total current assets 630,985 775,840
Goodwill 742,702 742,029
Deferred charges and other assets 288,678 350,929
$ 9,092,945 $ 8,594,704
Capitalization and Liabilities
Shareholders’ equity
Common stock, no par value (stated at $0.005 per share);
200,000,000 shares authorized; issued and outstanding:
2015 – 101,478,818 shares, 2014 – 100,388,092 shares $ 507 $ 502
Additional paid-in capital 2,230,591 2,180,151
Accumulated other comprehensive loss (109,330) (12,393)
Retained earnings 1,073,029 917,972
Shareholders’ equity 3,194,797 3,086,232
Long-term debt 2,455,388 2,455,986
Total capitalization 5,650,185 5,542,218
Current liabilities
Accounts payable and accrued liabilities 238,942 308,086
Other current liabilities 457,954 405,869
Short-term debt 457,927 196,695
Total current liabilities 1,154,823 910,650
Deferred income taxes 1,411,315 1,286,616
Regulatory cost of removal obligation 427,553 445,387
Pension and postretirement liabilities 287,373 340,963
Deferred credits and other liabilities 161,696 68,870
$ 9,092,945 $ 8,594,704
26 27