Anthem Blue Cross 2009 Annual Report Download - page 31
Download and view the complete annual report
Please find page 31 of the 2009 Anthem Blue Cross annual report below. You can navigate through the pages in the report by either clicking on the pages listed below, or by using the keyword search tool below to find specific information within the annual report.-
 1
1 -
2
-
3
-
4
-
5
-
6
-
7
-
8
-
9
-
10
-
11
-
12
-
13
-
14
-
15
-
16
-
17
-
18
-
19
-
20
-
 21
21 -
 22
22 -
 23
23 -
 24
24 -
 25
25 -
 26
26 -
 27
27 -
 28
28 -
 29
29 -
 30
30 -
 31
31 -
 32
32 -
 33
33 -
 34
34 -
 35
35 -
 36
36
 |
 |

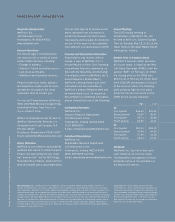
WELLPOINT, INC. 29
CONSOLIDATED BALANCE SHEETS
In millions, except per share data Years ended December 31 09 08
Assets
Current assets
Cash and cash equivalents $÷4,816.1 $÷2,183.9
Investments available-for-sale, at fair value 16,707.6 2,652.8
Other invested assets, current 26.5 23.6
Premium and self-funded receivables 3,281.0 3,042.9
Other receivables 1,052.3 1,546.7
Income tax receivable –159.9
Securities lending collateral 394.8 529.0
Deferred tax assets, net 523.8 779.0
Other current assets 1,268.6 1,212.2
Total current assets 28,070.7 12,130.0
Long-term investments available-for-sale, at fair value 262.9 11,839.1
Other invested assets, long-term 775.3 703.2
Property and equipment, net 1,099.6 1,054.5
Goodwill 13,264.6 13,461.3
Other intangible assets 8,259.3 8,827.2
Other noncurrent assets 393.0 387.9
Total assets $52,125.4 $48,403.2
Liabilities and shareholders’ equity
Liabilities
Current liabilities
Policy liabilities
Medical claims payable $÷5,450.5 $÷6,184.7
Reserves for future policy benefits 62.6 64.5
Other policyholder liabilities 1,617.6 1,626.8
Total policy liabilities 7,130.7 7,876.0
Unearned income 1,050.0 1,087.7
Accounts payable and accrued expenses 2,994.1 2,856.5
Income tax payable 1,228.7 –
Security trades pending payable 37.6 5.8
Securities lending payable 396.6 529.0
Short-term borrowings –98.0
Current portion of long-term debt 60.8 909.7
Other current liabilities 1,775.2 1,657.6
Total current liabilities 14,673.7 15,020.3
Long-term debt, less current portion 8,338.3 7,833.9
Reserves for future policy benefits, noncurrent 664.6 664.7
Deferred tax liability, net 2,470.4 2,098.9
Other noncurrent liabilities 1,115.1 1,353.7
Total liabilities 27,262.1 26,971.5
Shareholders’ equity
Common stock, par value $0.01 4.5 5.0
Additional paid-in capital 15,192.2 16,843.0
Retained earnings 9,598.5 5,479.4
Accumulated other comprehensive income (loss) 68.1 (895.7)
Total shareholders’ equity 24,863.3 21,431.7
Total liabilities and shareholders’ equity $52,125.4 $48,403.2
The information presented above should be read in conjunction with the audited financial statements and accompanying notes included in WellPoint’s
2009 Annual Report on Form 10-K.