Anthem Blue Cross 2009 Annual Report Download - page 26
Download and view the complete annual report
Please find page 26 of the 2009 Anthem Blue Cross annual report below. You can navigate through the pages in the report by either clicking on the pages listed below, or by using the keyword search tool below to find specific information within the annual report.-
 1
1 -
2
-
3
-
4
-
5
-
6
-
7
-
8
-
9
-
10
-
11
-
12
-
13
-
14
-
15
-
 16
16 -
 17
17 -
 18
18 -
 19
19 -
 20
20 -
 21
21 -
 22
22 -
 23
23 -
 24
24 -
 25
25 -
 26
26 -
 27
27 -
 28
28 -
 29
29 -
 30
30 -
 31
31 -
 32
32 -
 33
33 -
 34
34 -
 35
35 -
 36
36
 |
 |

24 WELLPOINT, INC.
WELLPOINT AT A GLANCE
Americans are covered by
WellPoint’s affiliated health plans
BLUE-LICENSED
SUBSIDIARIES
MISSION To improve the lives of the people we serve and the health of our communities.
9
IN
1
WellPoint works to simplify the connection between Health, Care and
Value. We help to improve the health of our communities, deliver better
care to members, and provide greater value to our customers and
shareholders. WellPoint is the nation’s largest health benefits company,
with 33.7 million members in its affiliated health plans.
KEY FINANCIAL METRICS
■Self-Funded 54%
■Fully Insured 46%
*
At December 31, 2009
■Local Group 47%
■National Accounts*20%
■BlueCard 14%
■Individual 6%
■State Sponsored 5%
■Federal Employee Program 4%
■Senior 4%
*
Including BlueCard
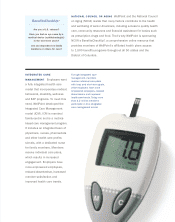
CUSTOMER BASE*
MEDICAL
MEMBERS
WellPoint’s affiliated
health plans have among
the most diverse customer
bases in the industry.
Individual
Individual customers under age
65 and their covered dependents.
Local Group
Employer customers with less
than 5% of eligible employees
located outside of the headquar-
ter state, as well as customers
with more than 5% of eligible
employees located outside of
the headquarter state with up
to 2,500 eligible employees.
National Accounts
Generally multi-state employer
groups primarily headquartered
in a WellPoint service area
with at least 5% of the eligible
employees located outside
of the headquarter state and
with more than 2,500 eligible
employees. Some exceptions
are allowed based on broker
relationships.
33.7
million
OPERATING REVENUE
(Dollars in billions)
OPERATING CASH FLOW
(Dollars in billions)
BENEFIT EXPENSE RATIO
60.8 3.0 82.6%
SELLING, GENERAL
AND ADMINISTRATIVE
EXPENSE RATIO
15.9%