Anthem Blue Cross 2003 Annual Report Download - page 29
Download and view the complete annual report
Please find page 29 of the 2003 Anthem Blue Cross annual report below. You can navigate through the pages in the report by either clicking on the pages listed below, or by using the keyword search tool below to find specific information within the annual report.-
 1
1 -
2
-
3
-
4
-
5
-
6
-
7
-
8
-
9
-
10
-
11
-
12
-
13
-
14
-
15
-
16
-
17
-
18
-
 19
19 -
 20
20 -
 21
21 -
 22
22 -
 23
23 -
 24
24 -
 25
25 -
 26
26 -
 27
27 -
 28
28 -
 29
29 -
 30
30 -
 31
31 -
 32
32 -
 33
33 -
 34
34 -
 35
35 -
 36
36
 |
 |

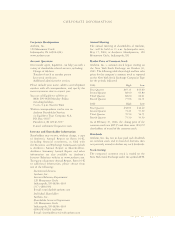
ANTHEM, INC. page 27
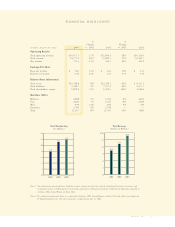
FINANCIAL HIGHLIGHTS
02001 2002 2003
3
6
9
12
15
$18
1
0
.
4
1
3
.
3
1
6
.
8
Total Revenue
(Dollars in Billions)
0
2
4
6
8
10
12
14
2001 2002 2003
7.
9
11
.1
1
1.
9
Total Membership
(In Millions)
Note 1: The information presented above should be read in conjunction with the audited consolidated financial statements and
accompanying notes and Management’s Discussion and Analysis of Financial Condition and Results of Operations included in
Anthem’s 2003 Annual Report on Form 10-K.
Note 2: The information presented above is as reported in Anthem’s 2003 Annual Report on Form 10-K and reflects the acquisition
of Trigon Healthcare, Inc. after the transaction’s completion on July 31, 2002.
%%
Change Change
(In Millions, Except Per Share Data) 2003 vs. 2002 2002 vs. 2001 2001
Operating Results
Total operating revenue $16,477.1 27% $12,990.5 28% $10,120.3
Total revenue 16,771.4 26% 13,282.3 27% 10,444.7
Net income 774.3 41% 549.1 60% 342.2
Earnings Per Share
Basic net income $ 5.60 21% $ 4.61 39% $ 3.31
Diluted net income 5.45 21% 4.51 37% 3.30
Balance Sheet Information
Total assets $13,438.6 8% $12,439.3 96% $ 6,337.1
Total liabilities 7,438.7 5% 7,077.0 65% 4,277.1
Total shareholders’ equity 5,999.9 12% 5,362.3 160% 2,060.0
Members (000s)
Midwest 5,688 9% 5,234 8% 4,854
East 2,600 7% 2,434 8% 2,260
West 939 12% 836 9% 769
Southeast 2,700 6% 2,549 ——
Total 11,927 8% 11,053 40% 7,883