Alcoa 2012 Annual Report Download - page 5
Download and view the complete annual report
Please find page 5 of the 2012 Alcoa annual report below. You can navigate through the pages in the report by either clicking on the pages listed below, or by using the keyword search tool below to find specific information within the annual report.-
 1
1 -
 2
2 -
 3
3 -
 4
4 -
 5
5 -
 6
6 -
 7
7 -
 8
8 -
 9
9 -
 10
10 -
 11
11 -
 12
12 -
 13
13 -
 14
14 -
 15
15 -
 16
16 -
17
-
18
-
19
-
20
-
21
-
22
-
23
-
24
-
25
-
26
-
27
-
28
-
29
-
30
-
31
-
32
-
33
-
34
-
35
-
36
-
37
-
38
-
39
-
40
-
41
-
42
-
43
-
44
-
45
-
46
-
47
-
48
-
49
-
50
-
51
-
52
-
53
-
54
-
55
-
56
-
57
-
58
-
59
-
60
-
61
-
62
-
63
-
64
-
65
-
66
-
67
-
68
-
69
-
70
-
71
-
72
-
73
-
74
-
75
-
76
-
77
-
78
-
79
-
80
-
81
-
82
-
83
-
84
-
85
-
86
-
87
-
88
-
89
-
90
-
91
-
92
-
93
-
94
-
95
-
96
-
97
-
98
-
99
-
100
-
101
-
102
-
103
-
104
-
105
-
106
-
107
-
108
-
109
-
110
-
111
-
112
-
113
-
114
-
115
-
116
-
117
-
118
-
119
-
120
-
121
-
122
-
123
-
124
-
125
-
126
-
127
-
128
-
129
-
130
-
131
-
132
-
133
-
134
-
135
-
136
-
137
-
138
-
139
-
140
-
141
-
142
-
143
-
144
-
145
-
146
-
147
-
148
-
149
-
150
-
151
-
152
-
153
-
154
-
155
-
156
-
157
-
158
-
159
-
160
-
161
-
162
-
163
-
164
-
165
-
166
-
167
-
168
-
169
-
170
-
171
-
172
-
173
-
174
-
175
-
176
-
177
-
178
-
179
-
180
-
181
-
182
-
183
-
184
-
185
-
186
-
187
-
188
-
189
-
190
-
191
-
192
-
193
-
194
-
195
-
196
-
197
-
198
-
199
-
200
 |
 |

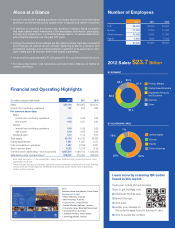
ALCOA 2012 Annual Report 3
Our smelter portfolio is on course to achieve
our 2015 targets, moving four percentage
points down the cost curve in 2012. We made
$245million in productivity improvements,
curtailed 240,000 metric tons of European
smelter capacity, permanently closed 291,000
metric tons of smelter capacity in the United
States, secured benefi cial long-term power
contracts and produced fi rst metal ahead of
schedule from the smelter coming online in
Saudi Arabia, which will be the lowest-cost
smelter in the world. We are also improving
margins in the Primary Metals segment by
converting more of the output from our cast
houses to value-add products, resulting in a
65% increase in value-add volume to external
customers and a 51% profi t increase since
2009.
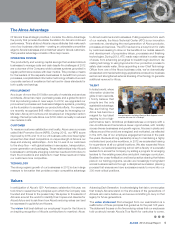
Every year, more than 200 teams of Alcoa employees are nominated
for extraordinary achievements producing substantial business
results. The teams compete for Alcoa Impact Awards in six
categories, and the winners are recognized at the annual Alcoa
Leadership Conference.
A team from Alcoa Global Primary Products in Europe won the
2012 Alcoa Impact Award in the Asset Management category for
implementing a project to improve forecasting accuracy and free
cash fl ow. The project resulted in a $67 million improvement in
accounts receivable.
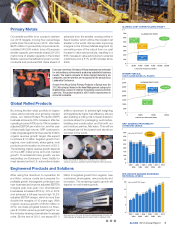
Primary Metals
By driving the fl at-rolled portfolio to higher
value-add products and growing market
share, our Global Rolled Products (GRP)
business achieved a 35% increase in after-tax
operating income (ATOI) and a 19% increase in
adjusted EBITDA per metric ton, another year
of historically high returns. GRP continues to
make progress against its three-year $2.5billion
organic revenue growth target. We expect
to achieve $1.5 billion targeted growth from
regions, new customers, share gains, new
products and innovation by the end of 2013.
The remaining organic revenue growth depends
on the LME metal price and end-market
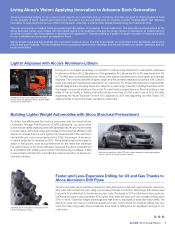
growth. To accelerate future growth, we are
expanding our Davenport, Iowa, facility to
meet demand as the U.S. automotive industry
shifts to aluminum to achieve light weighting
and signifi cantly higher fuel effi ciency. We are
also building a rolling mill in Saudi Arabia to
produce sheet for packaging, automotive,
building and construction and foil with our
joint venture partner, Ma’aden. This will be
an integral part of the lowest-cost aluminum
complex in the world.
Global Rolled Products
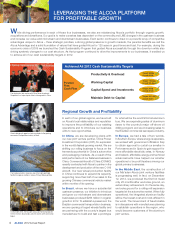
After using the downturn to reposition its
portfolio, reduce costs and prepare for
profi table growth, this segment continues to win
new business and improve adjusted EBITDA
margins year-over-year. Our downstream
businesses increased ATOI by 14% in 2012
and achieved a full-year record high 19.2%
adjusted EBITDA margin, which is more than
double the margins of 10 years ago. With
organic revenue growth of $180 million in
2012, we made progress toward our three-
year $1.6 billion revenue growth target for our
fi ve industry-leading downstream business
units. By the end of 2013, we expect $1.0
billion in targeted growth from regions, new
customers, share gains, new products and
innovation. The remaining organic growth will
depend on end-market growth.
Engineered Products and Solutions
Alcoa is expanding the rolling mill at Davenport, Iowa, to produce
aluminum coils for an automotive market shifting from steel to aluminum.
Alcoa aluminum is the metal of choice for building durable structures and
striking designs for buildings like this Cancer Center in Cleveland, Ohio.
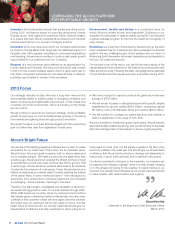
GRP: GROWING PROFITABILITY
AT RECORD LEVELS
0
50
100
150
200
250
300
350
400
$X.X
2002
2003
2004
2005
2006
2007
2008
2009
2010
2011
2012
273 253 249
276
226
201
108 119
314 327
390
Adjusted EBITDA/MT 10-YR
Average
~ $235/MT
$
PRIMARY METALS:
COST CURVE DOWN 4% POINTS
0
500
1,000
1,500
2,000
2,500
3,000
3,500
20,000 40,000 60,0000
Alcoa 2012
47th
Percentile Alcoa 2010
51st
Percentile
Alcoa 2015
41st
Percentile
ALUMINUM COST CURVE
CUMULATIVE PRODUCTION (000MT)
-10 points
$/mt
ALUMINA: COST CURVE HOLDING STEADY
0
100
200
300
400
500
600
700
100,00080,00060,00040,00020,0000120,000
Alcoa 2015
23rd
Percentile
Alcoa 2012
30th
Percentile
Alcoa 2010
30th
Percentile
ALUMINA COST CURVE
CUMULATIVE PRODUCTION (000MT)
-7 points
$/mt
EPS: RECORD MARGINS EXCEEDING
HISTORICAL LEVELS
0
5
10
15
20
2002
2003
2004
2005
2006
2007
2008
2009
2010
2011
2012
89
12 11 12 13
15
13
17 18 19
Adjusted EBITDA Margin
%