Alcoa 2012 Annual Report Download - page 4
Download and view the complete annual report
Please find page 4 of the 2012 Alcoa annual report below. You can navigate through the pages in the report by either clicking on the pages listed below, or by using the keyword search tool below to find specific information within the annual report.-
 1
1 -
 2
2 -
 3
3 -
 4
4 -
 5
5 -
 6
6 -
 7
7 -
 8
8 -
 9
9 -
 10
10 -
 11
11 -
 12
12 -
 13
13 -
 14
14 -
 15
15 -
16
-
17
-
18
-
19
-
20
-
21
-
22
-
23
-
24
-
25
-
26
-
27
-
28
-
29
-
30
-
31
-
32
-
33
-
34
-
35
-
36
-
37
-
38
-
39
-
40
-
41
-
42
-
43
-
44
-
45
-
46
-
47
-
48
-
49
-
50
-
51
-
52
-
53
-
54
-
55
-
56
-
57
-
58
-
59
-
60
-
61
-
62
-
63
-
64
-
65
-
66
-
67
-
68
-
69
-
70
-
71
-
72
-
73
-
74
-
75
-
76
-
77
-
78
-
79
-
80
-
81
-
82
-
83
-
84
-
85
-
86
-
87
-
88
-
89
-
90
-
91
-
92
-
93
-
94
-
95
-
96
-
97
-
98
-
99
-
100
-
101
-
102
-
103
-
104
-
105
-
106
-
107
-
108
-
109
-
110
-
111
-
112
-
113
-
114
-
115
-
116
-
117
-
118
-
119
-
120
-
121
-
122
-
123
-
124
-
125
-
126
-
127
-
128
-
129
-
130
-
131
-
132
-
133
-
134
-
135
-
136
-
137
-
138
-
139
-
140
-
141
-
142
-
143
-
144
-
145
-
146
-
147
-
148
-
149
-
150
-
151
-
152
-
153
-
154
-
155
-
156
-
157
-
158
-
159
-
160
-
161
-
162
-
163
-
164
-
165
-
166
-
167
-
168
-
169
-
170
-
171
-
172
-
173
-
174
-
175
-
176
-
177
-
178
-
179
-
180
-
181
-
182
-
183
-
184
-
185
-
186
-
187
-
188
-
189
-
190
-
191
-
192
-
193
-
194
-
195
-
196
-
197
-
198
-
199
-
200
 |
 |

ALCOA 2012 Annual Report2
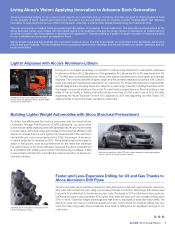
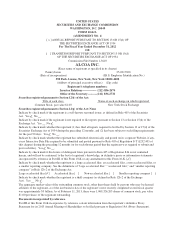
When increases in the cost of energy, raw materials, labor and pensions, among others,
were added to the net impact of the aluminum price decline and foreign currency movements,
the total negative impact to Alcoa’s 2012 income from continuing operations was $1.6 billion.
Fortunately, we were able to stay on course by following the three strategic priorities we
committed to in 2007: profi table growth, the Alcoa Advantage and disciplined execution.
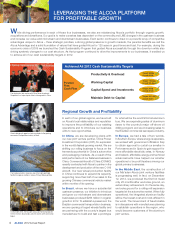
One of the main examples of disciplined execution continues to be our Cash Sustainability
Program initiatives. We used this approach successfully during the 2009 economic crisis to
reduce costs, improve productivity and generate cash; and we have made it part of our way
of doing business ever since. Thanks to the rigorous execution of those initiatives by every
Alcoa employee, and improvements in volume, price and mix, we offset the cost headwinds
and more than 35% of the net market impact of LME price and foreign currency movements.
After four consecutive years of achieving our cash sustainability targets, Alcoa is in a signifi cantly
stronger liquidity position than it was four years ago. We achieved free cash fl ow of $236 million
by capturing productivity improvements, managing total spend of capital expenditures and
reducing days working capital to a record low. Nowhere has the hard work and achievements
of Alcoans been more evident than in driving down days working capital by nearly 45% in the
last four years. We ended the year with less debt and a strong cash position, resulting in the
lowest year-end net debt level since 2006.
By successfully addressing the factors that we can control – operational, commercial and
fi nancial – we were able to compensate for the impact of those beyond Alcoa’s infl uence:
the economic and political volatility affecting our industry coupled with the decline in the LME
price of aluminum.
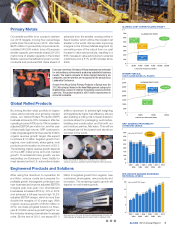
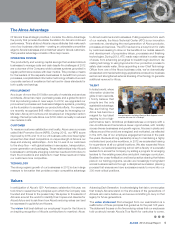
Offsetting price declines, we held steady on the refi ning cost curve by
capturing $190 million in productivity improvements and by curtailing
390,000 metric tons per year of high-cost refi nery capacity. To reach
our goal of moving seven points down the cost curve by 2015, we will
be optimizing our refi nery portfolio, moving to less expensive energy,
sustaining existing cost reductions and bringing on line the Ma’aden-
Alcoa joint venture refi nery in Saudi Arabia. We are also increasing
margins by shifting the pricing of smelter-grade alumina to an Alumina
Price Index (API) that better refl ects market fundamentals than the
LME. We increased external sales of API or spot-priced smelter-grade
alumina to approximately 40% in the fourth quarter of 2012, a jump
of 12 percentage points over the previous year. In 2013, we forecast
that on average 48% of our external smelter-grade alumina sales will
be priced against the API or spot price.
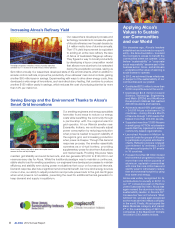
Alumina
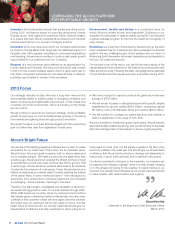
FINANCIAL PERFORMANCE
REDUCED DAYS WORKING CAPITAL
TO RECORD LEVELS
2008 2009 2010 2011 2012
43
33
30
27
24
-3 days
EXCEEDED PRODUCTIVITY* GAIN TARGETS
2009 2010 2011 2012 Total
2,410
742
1,099
1,291 5,542
$850
target for
2012
$ in millions
DISCIPLINED CAPITAL AND INVESTMENT SPEND
Capital Expenditures
2008 2009 2010 2011 2012
3,438
1,622
1,015
1,287 1,261
Saudi Arabia JV*
2010 2011 2012
160
249
177
$ in millions
REDUCED NET DEBT BY 29% SINCE 2008
2008 2009 2010 2011 2012
Cash Net Debt Debt to Cap
10,578
9,819
9,165 9,371 8,829
9,816
762
1,481
8,338 7,622 7,432 6,968
1,543 1,939 1,861
34.8%
35.3%
34.9%
38.7%
42.5%
$ in millions
Following the refi ning process,
alumina is shipped from
dedicated port facilities
to Alcoa’s smelters
and customers.
2011 LME
-$885
Market
+$1,005
Performance
-$670
Cost Headwinds
Currency Volume Price/Mix Productivity Energy Raw
Materials
Cost Increases/
Other
2012
-200
40
280
520
760
1,000
812 1,014
129
92
127
786 91
20
559
262
INCOME FROM CONTINUING OPERATIONS EXCLUDING RESTRUCTURING & OTHER SPECIAL ITEMS
$ in millions
* All fi gures are pretax and pre-minority interest. 2009/2010 represent net
productivity; 2011/2012 represent gross productivity.
* Includes spend related to the rolling mill automotive expansion project.