Air Canada 2006 Annual Report Download - page 18
Download and view the complete annual report
Please find page 18 of the 2006 Air Canada annual report below. You can navigate through the pages in the report by either clicking on the pages listed below, or by using the keyword search tool below to find specific information within the annual report.
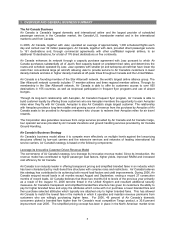
Pacific passenger revenues increased $3 million or 1 percent in Quarter 4 2006 compared to the same period in
2005 mainly due to a yield improvement. Yield improved 1 percent largely due to increased fuel surcharges to
offset higher fuel costs. A higher average business class fare was also a factor in the yield increase. Pacific
RASM increased 1 percent due to yield growth as the passenger load factor was essentially unchanged.
Other passenger revenues (comprised of South Pacific, Caribbean, Mexico and South America) increased $9
million or 6 percent in Quarter 4 2006 compared to Quarter 4 2005 due to traffic growth and a yield
improvement. Traffic grew 5 percent on a capacity increase of 1 percent resulting in a passenger load factor
improvement of 3.0 percentage points. Traffic growth occurred primarily in the South America and Mexico
markets. Yield rose 1 percent as a result of increased fuel surcharges to offset higher fuel costs. A higher
average business class fare was also a factor in the yield increase. For Quarter 4 2006, RASM increased 5
percent due primarily to the improvement in passenger load factor and partly to the yield increase.
Cargo Revenues
Cargo revenues for Quarter 4 2006 decreased $11 million or 6 percent from Quarter 4 2005. System traffic
declined 4 percent and cargo yield per revenue ton mile was down 2 percent. Freighter operations were
reduced from three to two chartered MD-11 aircraft effective November 2006 as compared to three MD-11
aircraft operated in Quarter 4 2005. As a result, freighter revenues declined $4 million or 9 per cent from 2005
on a 15 percent reduction to freighter capacity. Cargo revenues from non-freighter operations were down $7
million or 5 percent from the same period in 2005, mainly as a result of a 4 percent reduction to traffic and a 1
percent decline in yield per revenue ton mile. Lower cargo capacity in certain markets and adverse currency
movements impacted Cargo revenues in the quarter.
Other Revenues
For Quarter 4 2006, other revenues increased $33 million or 23 percent over the same period in 2005. Higher
revenues from Air Canada Vacations, mainly due to increased passenger volumes, accounted for approximately
$18 million of the increase. Other increases included flight cancellation and change fees, buy-on-board
revenues and other miscellaneous revenues.
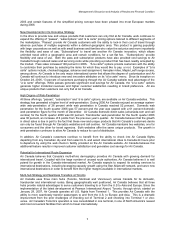
Operating Expenses
Operating expenses in Quarter 4 2006 rose $58 million or 2 percent over the corresponding period in 2005.
This increase in operating expenses over Quarter 4 2005 was largely connected to a 4 percent growth in
capacity as well as higher aircraft maintenance, materials and supplies expense.
Unit cost, as measured by operating expense per ASM, decreased 1 percent over Quarter 4 2005. The
following table compares Air Canada Services’ operating expenses per ASM for Quarter 4 2006 to Air Canada
Services’ operating expenses per ASM to the corresponding period in 2005.
($ cents per ASM)
2006 2005 $%
Salary and wages 2.60 2.63 (0.03) (1)
Benefits 0.49 0.72 (0.23) (32)
Ownership (DAR) (1) 1.46 1.42 0.04 3
Airport and navigation fees 1.62 1.61 0.01 1
Aircraft maintenance, materials and supplies 1.43 1.31 0.12 9
Food, beverages and supplies 0.53 0.56 (0.03) (5)
Commissions 0.34 0.34 -
-
Capacity purchase fees paid to Jazz 1.56 1.40 0.16 11
Other 2.83 2.94 (0.11) (4)
Operating expense, excluding fuel expense 12.86 12.93 (0.07) (1)
and the special charge for labour restructuring
(2)
Aircraft fuel 4.06 4.18 (0.12) (3)
Special charge for labour restructuring (0.05) - (0.05) n/a
Total operating expense 16.87 17.11 (0.24) (1)
Quarter 4 Change
(1) DAR refers to the combination of Aircraft rent and Depreciation, amortization and obsolescence.
(2) Refer to section 20 “Non-GAAP Financial Measures” in this MD&A for additional information.
18


