Aetna 2008 Annual Report Download - page 7
Download and view the complete annual report
Please find page 7 of the 2008 Aetna annual report below. You can navigate through the pages in the report by either clicking on the pages listed below, or by using the keyword search tool below to find specific information within the annual report.-
 1
1 -
 2
2 -
 3
3 -
 4
4 -
 5
5 -
 6
6 -
 7
7 -
 8
8 -
 9
9 -
 10
10 -
 11
11 -
 12
12 -
 13
13 -
 14
14 -
 15
15 -
 16
16 -
 17
17 -
 18
18 -
19
-
20
-
21
-
22
-
23
-
24
-
25
-
26
-
27
-
28
-
29
-
30
-
31
-
32
-
33
-
34
-
35
-
36
-
37
-
38
-
39
-
40
-
41
-
42
-
43
-
44
-
45
-
46
-
47
-
48
-
49
-
50
-
51
-
52
-
53
-
54
-
55
-
56
-
57
-
58
-
59
-
60
-
61
-
62
-
63
-
64
-
65
-
66
-
67
-
68
-
69
-
70
-
71
-
72
-
73
-
74
-
75
-
76
-
77
-
78
-
79
-
80
-
81
-
82
-
83
-
84
-
85
-
86
-
87
-
88
-
89
-
90
-
91
-
92
-
93
-
94
-
95
-
96
-
97
-
98
 |
 |

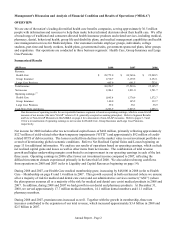
Management’s Discussion and Analysis of Financial Condition and Results of Operations (“MD&A”)
OVERVIEW
We are one of the nation’ s leading diversified health care benefits companies, serving approximately 36.5 million
people with information and resources to help them make better informed decisions about their health care. We offer
a broad range of traditional and consumer-directed health insurance products and related services, including medical,
pharmacy, dental, behavioral health, group life and disability plans, and medical management capabilities and health
care management services for Medicaid plans. Our customers include employer groups, individuals, college
students, part-time and hourly workers, health plans, governmental units, government-sponsored plans, labor groups
and expatriates. Our operations are conducted in three business segments: Health Care, Group Insurance and Large
Case Pensions.
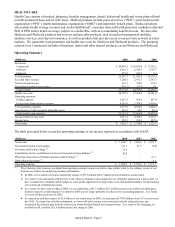
Summarized Results
(Millions) 2008 2007 2006
Revenue:
Heal th Care 28 ,775.0$ 24,768.6$ 22,240.5$
Group Insurance 1,710.7 2,139.5 2,152.1
Large Case Pensions 465.0 691.5 753.1
Total revenue 30,950.7 27,599.6 25,145.7
Net income 1,384.1 1,831.0 1,701.7
O
p
eratin
g
earnin
g
s: (1)
Health Care 1,895.
4
1,770.
9
1,572.7
Group Insurance 140.0 145.5 132.7
Large Case Pensions 39.2 38.1 38.9
Cash flows from operations 2,206.9 2,065.5 1,688.3
(1) Our discussion of operating results for our reportable business segments is based on operating earnings, which is a non-GAAP
measure of net income (the term “GAAP” refers to U.S. generally accepted accounting principles). Refer to Segment Results
and Use of Non-GAAP Measures in this MD&A on page 4 for a discussion of non-GAAP measures. Refer to pages 5, 9 and
10 for a reconciliation of operating earnings to net income for Health Care, Group Insurance and Large Case Pensions,
respectively.
Net income for 2008 includes after tax net realized capital losses of $482 million, primarily reflecting approximately
$327 million of yield-related other-than-temporary impairments (“OTTI”) and approximately $92 million of credit-
related OTTI of debt securities. The losses resulted from declines in the market value in our investment portfolio as
a result of deteriorating global economic conditions. Refer to Net Realized Capital Gains and Losses beginning on
page 13 for additional information. We analyze our results of operations based on operating earnings, which exclude
net realized capital gains and losses as well as other items from net income. The combination of total revenue
growth and higher underwriting margins contributed to an improvement in our operating earnings in each of the last
three years. Operating earnings in 2008 reflect lower net investment income compared to 2007, reflecting the
difficult investment climate experienced primarily in the latter half of 2008. We also achieved strong cash flows
from operations in 2008 and 2007 (refer to Liquidity and Capital Resources beginning on page 14).
During 2008 and 2007, our Health Care medical membership grew, increasing by 848,000 in 2008 (refer to Health
Care – Membership on page 8) and 1.4 million in 2007. This growth occurred in both our Insured (where we assume
all or a majority of risk for medical and dental care costs) and our administrative services contract (“ASC”) (where
the plan sponsor assumes all or a majority of the risk for medical and dental care costs) medical products in 2008 and
2007. In addition, during 2008 and 2007 we had growth in our dental and pharmacy products. At December 31,
2008, we served approximately 17.7 million medical members, 14.1 million dental members and 11.1 million
pharmacy members.
During 2008 and 2007, premium rates increased as well. Together with the growth in membership, these rate
increases contributed to the expansion of our total revenue, which increased approximately $3.4 billion in 2008 and
$2.5 billion in 2007.
Annual Report - Page 2