Aetna 2008 Annual Report Download - page 14
Download and view the complete annual report
Please find page 14 of the 2008 Aetna annual report below. You can navigate through the pages in the report by either clicking on the pages listed below, or by using the keyword search tool below to find specific information within the annual report.-
 1
1 -
2
-
3
-
 4
4 -
 5
5 -
 6
6 -
 7
7 -
 8
8 -
 9
9 -
 10
10 -
 11
11 -
 12
12 -
 13
13 -
 14
14 -
 15
15 -
 16
16 -
 17
17 -
 18
18 -
 19
19 -
 20
20 -
 21
21 -
 22
22 -
 23
23 -
 24
24 -
25
-
26
-
27
-
28
-
29
-
30
-
31
-
32
-
33
-
34
-
35
-
36
-
37
-
38
-
39
-
40
-
41
-
42
-
43
-
44
-
45
-
46
-
47
-
48
-
49
-
50
-
51
-
52
-
53
-
54
-
55
-
56
-
57
-
58
-
59
-
60
-
61
-
62
-
63
-
64
-
65
-
66
-
67
-
68
-
69
-
70
-
71
-
72
-
73
-
74
-
75
-
76
-
77
-
78
-
79
-
80
-
81
-
82
-
83
-
84
-
85
-
86
-
87
-
88
-
89
-
90
-
91
-
92
-
93
-
94
-
95
-
96
-
97
-
98
 |
 |

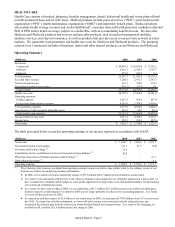
day care, assisted living or nursing facilities. We no longer solicit or accept new long-term care customers, and we
are working with our customers on an orderly transition of this product to other carriers.
Operating Summary
(Millions) 2008 2007 2006
Premiums:
Life 1,062.7$ 1,201.4$ 1,257.6$
Disability 534.6 478.8 401.5
Long-term care 86.3 93.8 102.8
Total premiums 1,683.6 1,774.0 1,761.9
Fees and other revenue 97.9 101.1 84.6
Net investment income 240.4 303.0 294.1
Net realized capital (losses) gains (311.2) (38.6) 11.5
Total revenue 1,710.7 2,139.5 2,152.1
Current and future benefits 1,468.8 1,619.2 1,646.8
Operating expenses:
Selling expenses 94.4 94.3 85.3
General and administrative expenses 305.7 261.9 232.3
Total operating expenses 400.1 356.2 317.6
Amortization of other acquired intangible assets 6.9 6.9 5.2
Total benefits and expenses 1,875.8 1,982.3 1,969.6
(Loss) income before income taxes (165.1) 157.2 182.5
Income taxes (53.0) 36.8 48.6
Net (loss) income (112.1)$ 120.4$ 133.9$
The table presented below reconciles operating earnings to net income reported in accordance with GAAP:
(Millions) 2008 2007 2006
Net (loss) income (112.1)$ 120.4$ 133.9$
Net realized capital losses (gains) 224.7 25.1 (7.4)
Allowance on reinsurance recoverable
(1)
27.4 - -
Acquisition-related software charge
(1)
- - 6.2
Operating earnings 140.0$ 145.5$ 132.7$
(1) The following other items are excluded from operating earnings because we believe they neither relate to the ordinary course of
our business nor reflect our underlying business performance:
• As a result of the liquidation proceedings of Lehman Re Ltd. (“Lehman Re”), a subsidiary of Lehman Brothers Holdings
Inc., we recorded an allowance against our reinsurance recoverable from Lehman Re of $27.4 million ($42.2 million pretax)
in 2008. This reinsurance is on a closed block of paid-up group whole life insurance business.
• As a result of the acquisition of Broadspire Disability in 2006, we acquired certain software which eliminated the need for
similar software we had been developing internally. As a result, we ceased our own software development and impaired
amounts previously capitalized, resulting in a $6.2 million ($8.3 million pretax) charge to net income, reflected in general
and administrative expenses for 2006.
Operating earnings for 2008 decreased $6 million when compared to 2007, reflecting lower net investment income
partially offset by a higher underwriting margin due to favorable disability and long-term care results. Lower net
investment income in 2008 compared to 2007 was primarily due to lower income from alternative investments.
Operating earnings for 2007 increased $13 million compared to 2006, reflecting a higher underwriting margin and
higher net investment income partially offset by higher general and administrative expenses. The 2007 growth in
fees and other revenue and general and administrative expenses primarily related to the March 2006 acquisition of
Broadspire Disability.
Life premiums decreased in 2008 compared to 2007 reflecting the lapse of several large customers, however these
lapses did not materially affect operating earnings.
Our group benefit ratios were 87.2% for 2008, 91.3% for 2007 and 93.5% for 2006. The decrease in our group
benefit ratio for 2008 compared to 2007 was primarily due to favorable disability and long-term care experience.
The decrease in our group benefit ratio in 2007 compared to 2006 was primarily due to favorable life and disability
experience.
Annual Report - Page 9