Aetna 2006 Annual Report Download - page 8
Download and view the complete annual report
Please find page 8 of the 2006 Aetna annual report below. You can navigate through the pages in the report by either clicking on the pages listed below, or by using the keyword search tool below to find specific information within the annual report.-
 1
1 -
 2
2 -
 3
3 -
 4
4 -
 5
5 -
 6
6 -
 7
7 -
 8
8 -
 9
9 -
 10
10 -
 11
11 -
 12
12 -
 13
13 -
 14
14 -
 15
15 -
 16
16 -
 17
17 -
 18
18 -
 19
19 -
20
-
21
-
22
-
23
-
24
-
25
-
26
-
27
-
28
-
29
-
30
-
31
-
32
-
33
-
34
-
35
-
36
-
37
-
38
-
39
-
40
-
41
-
42
-
43
-
44
-
45
-
46
-
47
-
48
-
49
-
50
-
51
-
52
-
53
-
54
-
55
-
56
-
57
-
58
-
59
-
60
-
61
-
62
-
63
-
64
-
65
-
66
-
67
-
68
-
69
-
70
-
71
-
72
-
73
-
74
-
75
-
76
-
77
-
78
-
79
-
80
-
81
-
82
-
83
-
84
-
85
-
86
-
87
-
88
-
89
-
90
-
91
-
92
-
93
-
94
-
95
-
96
-
97
-
98
-
99
-
100
-
101
-
102
 |
 |

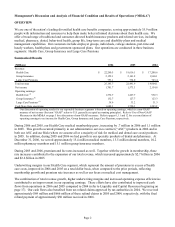
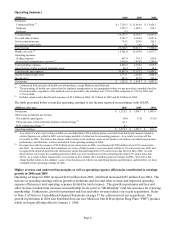
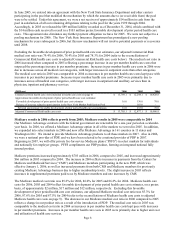
Operating Summary
(Millions) 2006 2005 2004
Premiums:
Commercial Risk
(1)
17,356.5$ 15,919.6$ 13,924.1$
Medicare 1,787.7 1,005.1 938.7
Medicaid 9.3 - -
Total premiums 19,153.5 16,924.7 14,862.8
Fees and other revenue 2,743.7 2,385.8 2,051.6
Net investment income 334.2 295.0 262.1
Net realized capital gains 9.1 10.6 24.1
Total revenue 22,240.5 19,616.1 17,200.6
Health care costs
(2)
15,301.0 13,107.9 11,637.7
Operating expenses:
Selling expenses 867.4 763.3 630.9
General and administrative expenses
(3)
3,618.6 3,424.9 3,289.0
Total operating expenses 4,486.0 4,188.2 3,919.9
Amortization of other acquired intangible assets 80.4 57.4 42.5
Total benefits and expenses 19,867.4 17,353.5 15,600.1
Income before income taxes 2,373.1 2,262.6 1,600.5
Income taxes 847.6 827.9 592.6
Net income 1,525.5$ 1,434.7$ 1,007.9$
(1) Commercial Risk includes all health care risk products, except Medicare and Medicaid.
(2) The percentage of health care costs related to capitated arrangements (a fee arrangement where we pay providers a monthly fixed fee
for each member, regardless of the medical services provided to the member) was 5.9% for 2006 compared to 7.9% for 2005 and
9.1% for 2004.
(3) Includes salaries and related benefit expenses of $2.2 billion in 2006, $2.1 billion in 2005 and $2.0 billion in 2004.
The table presented below reconciles operating earnings to net income reported in accordance with GAAP:
(Millions, after tax) 2006 2005 2004
Net income 1,525.5$ 1,434.7$ 1,007.9$
Other items included in net income:
Net realized capital gains (8.0) (7.0) (15.6)
Physician class action settlement insurance-related charge
(1)
47.1 - -
Debt refinancing charge
(2)
8.1 - -
Operating earnings 1,572.7$ 1,427.7$ 992.3$
(1) As a result of a trial court’ s ruling in 2006, we concluded that a $72.4 million pretax receivable from third party insurers related to
certain litigation we settled in 2003 was no longer probable of collection for accounting purposes. As a result, we wrote off this
receivable in 2006. We believe this charge neither relates to the ordinary course of our business nor reflects our underlying business
performance, and therefore, we have excluded it from operating earnings in 2006.
(2) In connection with the issuance of $2.0 billion of our senior notes in 2006, we redeemed all $700 million of our 8.5% senior notes
due 2041. In connection with this redemption, we wrote off debt issuance costs associated with the 8.5% senior notes due 2041 and
recognized the deferred gain from the interest rate swaps that had hedged the 8.5% senior notes due 2041 (in May 2005, we sold
these interest rate swaps; the resulting gain from which was to be amortized over the remaining life of the 8.5% senior notes due
2041). As a result of these transactions, we recorded an $8.1 million ($12.4 million pretax) net charge in 2006. We believe this
charge neither relates to the ordinary course of our business nor reflects our underlying business performance, and therefore, we have
excluded it from operating earnings in 2006.
Higher revenue and underwriting margins as well as operating expense efficiencies contributed to earnings
growth in 2006 and 2005
Operating earnings for 2006 increased $145 million from 2005, which had increased $435 million from 2004. The
increase in operating earnings reflects growth in premiums and fees and other revenue and improved operating
expense efficiencies (total operating expenses divided by total revenue). The growth in premiums and fees and
other revenue resulted from increases in membership levels (refer to “Membership”) and rate increases for renewing
membership. Furthermore, growth in premiums and fees and other revenue reflects our recent acquisitions. Refer
to Note 3 of Notes to Consolidated Financial Statements on page 57 for a discussion of our acquisitions. Our
growth in premiums in 2006 also benefited from our new Medicare Part D Prescription Drug Plan (“PDP”) product,
which we began offering effective January 1, 2006.
Page 6