Aetna 2006 Annual Report Download - page 10
Download and view the complete annual report
Please find page 10 of the 2006 Aetna annual report below. You can navigate through the pages in the report by either clicking on the pages listed below, or by using the keyword search tool below to find specific information within the annual report.-
 1
1 -
 2
2 -
 3
3 -
 4
4 -
 5
5 -
 6
6 -
 7
7 -
 8
8 -
 9
9 -
 10
10 -
 11
11 -
 12
12 -
 13
13 -
 14
14 -
 15
15 -
 16
16 -
 17
17 -
 18
18 -
 19
19 -
 20
20 -
 21
21 -
22
-
23
-
24
-
25
-
26
-
27
-
28
-
29
-
30
-
31
-
32
-
33
-
34
-
35
-
36
-
37
-
38
-
39
-
40
-
41
-
42
-
43
-
44
-
45
-
46
-
47
-
48
-
49
-
50
-
51
-
52
-
53
-
54
-
55
-
56
-
57
-
58
-
59
-
60
-
61
-
62
-
63
-
64
-
65
-
66
-
67
-
68
-
69
-
70
-
71
-
72
-
73
-
74
-
75
-
76
-
77
-
78
-
79
-
80
-
81
-
82
-
83
-
84
-
85
-
86
-
87
-
88
-
89
-
90
-
91
-
92
-
93
-
94
-
95
-
96
-
97
-
98
-
99
-
100
-
101
-
102
 |
 |

In June 2005, we entered into an agreement with the New York State Insurance Department and other carriers
participating in the pool that modified the mechanism by which the amounts due to (or receivable from) the pool
were to be settled. Under this agreement, we were a net receiver of approximately $14 million in cash from the
pool in satisfaction of all our remaining obligations relating to the pool for the years 1999 through 2004.
Accordingly, in 2005 we released the $89 million liability recorded as of December 31, 2004, which combined with
the $14 million cash received to result in a $103 million pretax favorable development of prior period health care
costs. This agreement also eliminates any further payment obligation we have for 2005. We were not subject to a
pooling mechanism for 2006. The New York State Insurance Department has promulgated a new pooling
mechanism for years subsequent to 2006, but this new mechanism will not involve potential payments or recoveries
until 2008.
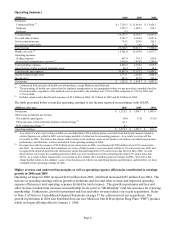
Excluding the favorable development of prior period health care cost estimates, our adjusted Commercial Risk
medical cost ratio was 79.4% for 2006, 78.4% for 2005 and 78.3% for 2004 (refer to the reconciliations of
Commercial Risk health care costs to adjusted Commercial Risk health care costs below). The medical cost ratio in
2006 increased when compared to 2005 reflecting a percentage increase in our per member health care costs that
outpaced the percentage increase in per member premiums. Increases in per member health care costs in 2006 were
due to increases across all medical cost categories, with larger increases in outpatient costs than other categories.
The medical cost ratio in 2005 was comparable to 2004 as increases in per member health care costs kept pace with
increases in per member premiums. Increases in per member health care costs in 2005 were primarily due to
increases across all medical cost categories, with larger increases in outpatient and ancillary services than in
physician, inpatient and pharmacy services.
(Millions) 2006 2005 2004
Commercial Risk health care costs (included in health care costs on page 6) 13,769.1$ 12,244.1$ 10,828.8$
Approximate favorable development of prior period health care cost estimates:
Favorable development of prior period health care cost estimates 16.0 130.0 78.0
Release of reserves related to participation in the New York Market Stabilization Pool - 103.0 -
Subtotal approximate favorable development of prior period health care cost estimates 16.0 233.0 78.0
Adjusted Commercial Risk health care costs 13,785.1$ 12,477.1$ 10,906.8$
Medicare results in 2006 reflects growth from 2005; Medicare results in 2005 were comparable to 2004
Our Medicare Advantage contracts with the federal government are renewable for a one-year period on a calendar-
year basis. In 2006, we offered a Medicare Advantage option in all of the markets we served in 2005. In addition,
we expanded into select markets in 2006 and now offer Medicare Advantage in 161 counties in 13 states and
Washington D.C. We intend to provide Medicare Advantage products to all these markets in 2007. Also in 2006,
we were a national provider of PDP, and we have been selected to be a national provider of PDP in 2007.
Beginning in 2007, we will offer private fee-for-service Medicare plans (“PFFS”) in select markets for individuals
and nationally for employer groups. PFFS compliments our PDP product, forming an integrated national fully
insured product.
Medicare premiums increased approximately $783 million in 2006, compared to 2005, and increased approximately
$66 million in 2005 compared to 2004. The increase in 2006 reflects increases in payments from the Centers for
Medicare and Medicaid Services (“CMS”) and Medicare members participating in the new PDP, which was
effective January 1, 2006, as well as increased payments from both CMS and Medicare members for previously
existing Medicare Advantage business due to higher membership levels. The slight increase in 2005 reflects
increases in supplemental premiums paid to us by Medicare members and rate increases by CMS.
The Medicare medical cost ratio was 85.2% for 2006, 86.0% for 2005 and 86.2% for 2004. Medicare health care
costs for 2006, 2005 and 2004 reflect favorable development of prior period health care cost estimates, on a pretax
basis, of approximately $2 million, $17 million and $12 million, respectively. Excluding this favorable
development of prior period health care cost estimates, our adjusted Medicare medical cost ratio was 85.3% for
2006, 87.6% for 2005 and 87.5% for 2004 (refer to the reconciliations of Medicare health care costs to adjusted
Medicare health care costs on page 9). The decrease in our Medicare medical cost ratio in 2006 compared to 2005
reflects a change in our product mix as a result of the introduction of PDP. The medical cost ratio in 2005 was
comparable to the medical cost ratio in 2004 as increases in per member health care costs kept pace with increases
in per member premiums. Increases in per member health care costs in 2005 were primarily due to higher unit cost
and utilization of health care services.
Page 8