Aetna 2006 Annual Report Download - page 17
Download and view the complete annual report
Please find page 17 of the 2006 Aetna annual report below. You can navigate through the pages in the report by either clicking on the pages listed below, or by using the keyword search tool below to find specific information within the annual report.-
 1
1 -
2
-
3
-
4
-
5
-
6
-
 7
7 -
 8
8 -
 9
9 -
 10
10 -
 11
11 -
 12
12 -
 13
13 -
 14
14 -
 15
15 -
 16
16 -
 17
17 -
 18
18 -
 19
19 -
 20
20 -
 21
21 -
 22
22 -
 23
23 -
 24
24 -
 25
25 -
 26
26 -
 27
27 -
28
-
29
-
30
-
31
-
32
-
33
-
34
-
35
-
36
-
37
-
38
-
39
-
40
-
41
-
42
-
43
-
44
-
45
-
46
-
47
-
48
-
49
-
50
-
51
-
52
-
53
-
54
-
55
-
56
-
57
-
58
-
59
-
60
-
61
-
62
-
63
-
64
-
65
-
66
-
67
-
68
-
69
-
70
-
71
-
72
-
73
-
74
-
75
-
76
-
77
-
78
-
79
-
80
-
81
-
82
-
83
-
84
-
85
-
86
-
87
-
88
-
89
-
90
-
91
-
92
-
93
-
94
-
95
-
96
-
97
-
98
-
99
-
100
-
101
-
102
 |
 |

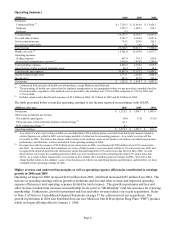
Total investments at December 31, 2006 and 2005 were as follows:
(Millions) Current Long-term Total Current Long-term Total
Debt securities available for sale:
Available for use in current operations 13,293.8$ -$ 13,293.8$ 13,216.9$ -$ 13,216.9$
Loaned securities 1,018.1 - 1,018.1 1,115.7 - 1,115.7
On deposit, as required by regulatory
authorities - 555.0 555.0 - 522.4 522.4
Debt securities available for sale 14,311.9 555.0 14,866.9 14,332.6 522.4 14,855.0
Equity securities available for sale 32.8 38.3 71.1 34.5 26.7 61.2
Short-term investments 110.6 - 110.6 114.8 - 114.8
Mortgage loans 207.4 1,380.8 1,588.2 86.7 1,460.8 1,547.5
Other investments 3.0 1,247.3 1,250.3 10.1 1,320.2 1,330.3
Total investments 14,665.7$ 3,221.4$ 17,887.1$ 14,578.7$ 3,330.1$ 17,908.8$
2006 2005
Debt and Equity Securities
Debt securities represented 83% at both December 31, 2006 and 2005 of our total invested assets and supported
the following types of products:
(Millions) 2006 2005
Supporting discontinued products 3,107.6$ 3,342.9$
Supporting experience-rated products 1,672.8 1,920.8
Supporting remaining products 10,086.5 9,591.3
Total debt securities 14,866.9$ 14,855.0$
The debt securities in our portfolio are generally rated by external rating agencies and, if not externally rated, are
rated by us on a basis we believe to be similar to that used by the rating agencies. Our investments in debt
securities had an average quality rating of A+ at December 31, 2006 and 2005 (36% and 34% were AAA at
December 31, 2006 and 2005, respectively). We consider debt securities that have a quality rating below BBB-
/Baa3 to be below investment grade. Total debt securities include below investment grade securities of $925
million at December 31, 2006 and $967 million at December 31, 2005, of which 23% at December 31, 2006 and
25% at December 31, 2005 support discontinued and experience-rated products.
We have classified our debt and equity securities as available for sale and carry them at fair value. Fair values for
such securities are based on quoted market prices. Non-traded debt securities are priced independently by a third-
party vendor, and non-traded equity securities are priced based on an internal analysis of the investment’ s financial
statements and cash flow projections. The carrying value of non-traded debt and equity securities at December 31,
2006 and 2005 were as follows:
Debt Equity Debt Equity
(Millions) Securities Securities Total Securities Securities Total
Supporting discontinued and experience-rated products 149.8$ 37.9$ 187.7$ 199.3$ 26.6$ 225.9$
Supporting remaining products 4.2 .4 4.6 2.4 .2 2.6
Total non-traded securities 154.0$ 38.3$ 192.3$ 201.7$ 26.8$ 228.5$
2006 2005
Debt securities reflect net unrealized capital gains of $276 million (comprised of gross unrealized capital gains of
$415 million and gross unrealized losses of $139 million) at December 31, 2006 compared with net unrealized
capital gains of $494 million (comprised of gross unrealized capital gains of $623 million and gross unrealized
losses of $129 million) at December 31, 2005. Of the net unrealized capital gains at December 31, 2006, $142
million relate to assets supporting discontinued products and $52 million relate to experience-rated products. Of
the net unrealized capital gains at December 31, 2005, $250 million relate to assets supporting discontinued
products and $103 million relate to experience-rated products.
Page 15