Adidas 1997 Annual Report Download - page 8
Download and view the complete annual report
Please find page 8 of the 1997 Adidas annual report below. You can navigate through the pages in the report by either clicking on the pages listed below, or by using the keyword search tool below to find specific information within the annual report.-
 1
1 -
 2
2 -
 3
3 -
 4
4 -
 5
5 -
 6
6 -
 7
7 -
 8
8 -
 9
9 -
 10
10 -
 11
11 -
 12
12 -
 13
13 -
 14
14 -
 15
15 -
 16
16 -
 17
17 -
 18
18 -
 19
19 -
20
-
21
-
22
-
23
-
24
-
25
-
26
-
27
-
28
-
29
-
30
-
31
-
32
-
33
-
34
-
35
-
36
-
37
-
38
-
39
-
40
-
41
-
42
-
43
-
44
-
45
-
46
-
47
-
48
-
49
-
50
-
51
-
52
-
53
-
54
-
55
-
56
-
57
-
58
-
59
-
60
-
61
-
62
-
63
 |
 |

6
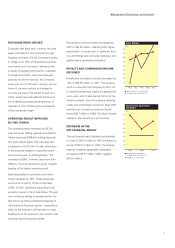
Currency erosion in several Asian countries
during the last quarter of 1997
had virtually
no impact on the improvement of
gross
margin. Although adidas sources about 95%
of footwear and around 60% of apparel in
countries in South-East Asia and most prod-
ucts are purchased from suppliers in US
dollar, there are a number of reasons why the
effect of the currency crisis has not been
experienced in 1997:
(1) FOB prices for products purchased in the
fourth quarter are typically negotiated in
the second quarter;
(2) most of the suppliers’ raw materials costs
are priced in US dollar or other major cur-
rencies and
(3) a significant portion of adidas production
is carried out in countries which did not
experience major devaluations e.g. China.
It should also be remembered that, apart
from price, adidas’ sourcing policy includes
other selection parameters for factories such
as product quality, adherence to delivery
deadlines and acceptable transportation dis-
tances. In order to find the best possible
compromise between the different require-
ments, adidas pursues a long-term sourcing
strategy. One of the key aspects of this strat-
egy is to establish long-term ties
with manu-
facturers which have a track record
of deliver-
ing the high quality required by adidas. Such
a policy therefore also involves not always
taking advantage of every short-term price
spread offered by countries with strongly
depreciated currencies. However, Manage-
ment expects to see some positive effect on
FOB prices in 1998 as a result of both the
Asian currency position and adidas’ strength-
ening order book.
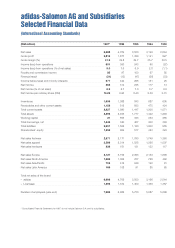
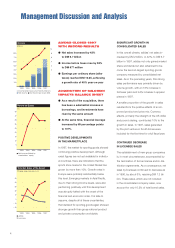
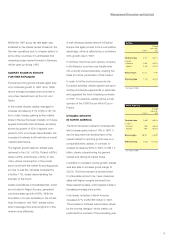
EXCELLENT SALES LEVELS
REACHED WITH APPAREL
In 1997, adidas again achieved higher growth
rates with apparel than with footwear. Net
sales of apparel grew by 55%, reaching
DM 3,586 million and increasing this divi-
sion’s share of total company sales to 54%,
almost five percentage points up on 1996.
The all-purpose category remained the largest
product category in apparel, representing
around two thirds of total apparel sales. The
lifestyle and workout categories made an
even more substantial contribution to sales
growth in relative terms, with above-average
growth rates. Sales of soccer apparel re-
mained at the previous year’s high level.
GROWTH ALSO ACHIEVED
IN HARDWARE AND OTHER SALES
Hardware and other sales, which consist
mainly of
bags, balls and accessories, in-
creased
by 7% to DM 241 million in 1997,
resulting in a slight decrease in this division’s
share of total sales to 3.6% (1996: 4.8%).
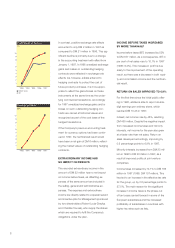
GROSS PROFIT IMPROVED,
SOURCING COSTS UNDER CONTROL
Gross profit improved by 49.7%, growing
at a faster rate than sales and reaching
DM 2,810 million. As a result, gross margin
as a percentage of net sales increased by
over two percentage points to 41.9% in 1997.
This success was due to careful choice of
manufacturers, cost-oriented negotiations with
suppliers and continuing tight control of other
sourcing costs. Additionally, this development
was positively influenced by the fact that ap-
parel sales generated higher growth rates,
thus increasing its share of total company
sales. The appar
el business traditionally
has
higher margins than the footwear business.
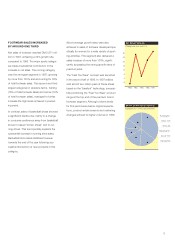
Shares of Net Sales Apparel
(Categories in % of net sales apparel)
Others 6.6
Workout 5.8
Lifestyle 7.7
Soccer 14.0
All-purpose 65.9
n
n
n
n
n
1993 1994 1995 1996 1997
Net Sales Apparel
(Change year-over-year in %)
60
50
40
30
20
10
0
– 10
n
n
n
n
n