Adidas 1997 Annual Report Download - page 14
Download and view the complete annual report
Please find page 14 of the 1997 Adidas annual report below. You can navigate through the pages in the report by either clicking on the pages listed below, or by using the keyword search tool below to find specific information within the annual report.-
 1
1 -
2
-
3
-
 4
4 -
 5
5 -
 6
6 -
 7
7 -
 8
8 -
 9
9 -
 10
10 -
 11
11 -
 12
12 -
 13
13 -
 14
14 -
 15
15 -
 16
16 -
 17
17 -
 18
18 -
 19
19 -
 20
20 -
 21
21 -
 22
22 -
 23
23 -
 24
24 -
25
-
26
-
27
-
28
-
29
-
30
-
31
-
32
-
33
-
34
-
35
-
36
-
37
-
38
-
39
-
40
-
41
-
42
-
43
-
44
-
45
-
46
-
47
-
48
-
49
-
50
-
51
-
52
-
53
-
54
-
55
-
56
-
57
-
58
-
59
-
60
-
61
-
62
-
63
 |
 |

12
ACQUISITION OF SALOMON IMPACTS
BALANCE SHEET: SUBSTANTIAL
INCREASE IN NON-CURRENT ASSETS
AND LIABILITIES
The acquisition of the Salomon family holding
company at the end of December had a sig-
nificant impact on the balance sheet for the
fiscal year ended 1997. In a first step, adidas
acquired 100% of the share capital of Sport
Développement S.C.A. (the former Salomon
family holding company, now re-named
adidas Salomon France S.A.), a French com-
pany registered in Annecy, France. This com-
pany held 56% of the voting rights and
39%
of the capital of Salomon S.A. and was
purchased for a total acquisition cost
of
DM 942 million. The growth
in non-current
assets, which rose by DM 1,001 million to
DM 1,467 million, is therefore almost solely
the result of the increase in investments,
which in turn resulted from the acquisition of
the Salomon family holding company.
These effects are correspondingly reflected in
the growth in liabilities. As the acquisition of
the family holding company was funded by
using and increasing the amounts available
under existing credit lines, there was also
a significant rise in short-term borrowings,
which increased by a total of DM 1,059 mil-
lion to DM 1,525 million.
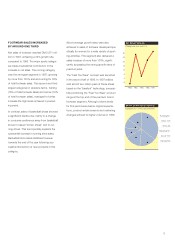
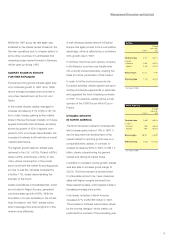
As a result of the 100% debt-financing of the
acquisition of the Salomon family holding
company, financial leverage increased from
38% in 1996 to 107% in 1997.
adidas has cash credit lines amounting to
DM 5.8 billion. As of December 31, 1997 un-
used cash credit lines amounted to DM 4.2
billion. An amount of approximately DM 1.5
billion was subsequently used to complete the
acquisition of Salomon S.A. through the public
tender offer in February. Remaining unused
cash credit lines will be sufficient to fund
increasing product purchase requirements.
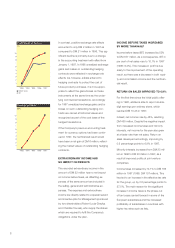
DECREASE IN OPERATING
CASH FLOW –
AS A RESULT OF
HIGHER TAX PAYMENTS
Operating cash flow totalled DM 78 million,
which is DM 123 million below the previous
year’s level. This decrease is primarily the
result of a DM 92 million increase in tax pay-
ments and increased inventory levels to sup-
port expected growth in 1998.
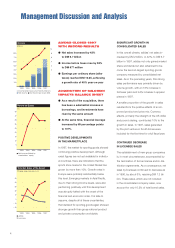
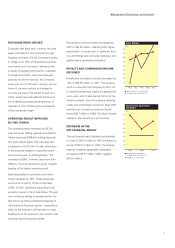
OUTLOOK
BACKLOG INCREASED BY
MORE THAN 50%
Orders on hand at the end of 1997 amounted
to DM 3,172 million, which represents an
increase of 56% or DM 1,136 million com-
pared to the end of 1996. Order backlog is
an indication of sales development to be an-
ticipated for the first six months of 1998, as the
order volume covers the 1998 spring/summer
season. However, the order volume only
comprises the 13 largest subsidiaries of
adidas – excluding South Korea – which
account for approximately two thirds of
adidas’ total business. Variation in sales mix
as well as reorders and/or cancellations
could still change the order profile to some
extent going into the spring/summer season.
The increase in order volume was led by North
America, which showed growth of 101%,
followed by Europe with 35%. Due to the
uncertain economic development, figures for
Asia are less reliable. adidas expects, never-
theless, a modest growth in order volume for
the first six months of 1998.
In Region Europe, the strongest backlog
growth was seen in Spain with 121%. The
U.K., Italy, Switzerland, France and Norway
all showed backlog growth of more than 25%
compared to 1996.
1993 1994 1995 1996 1997
Financial Leverage
(%)
100
90
80
70
60
50
40
30
20
10
nNet borrowings divided by
shareholders’ equity
n
n
nn
n