Adidas 1997 Annual Report Download - page 6
Download and view the complete annual report
Please find page 6 of the 1997 Adidas annual report below. You can navigate through the pages in the report by either clicking on the pages listed below, or by using the keyword search tool below to find specific information within the annual report.-
 1
1 -
 2
2 -
 3
3 -
 4
4 -
 5
5 -
 6
6 -
 7
7 -
 8
8 -
 9
9 -
 10
10 -
 11
11 -
 12
12 -
 13
13 -
 14
14 -
 15
15 -
 16
16 -
 17
17 -
18
-
19
-
20
-
21
-
22
-
23
-
24
-
25
-
26
-
27
-
28
-
29
-
30
-
31
-
32
-
33
-
34
-
35
-
36
-
37
-
38
-
39
-
40
-
41
-
42
-
43
-
44
-
45
-
46
-
47
-
48
-
49
-
50
-
51
-
52
-
53
-
54
-
55
-
56
-
57
-
58
-
59
-
60
-
61
-
62
-
63
 |
 |

4
Management Discussion and Analysis
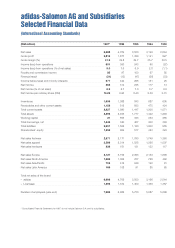
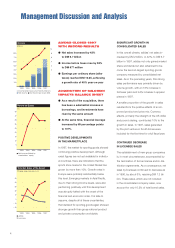
ADIDAS CLOSES 1997
WITH RECORD RESULTS
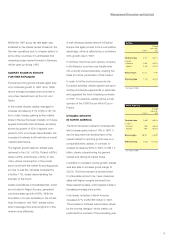
vNet sales increased by 42%
to DM 6.7 billion
vIncome before taxes rose by 52%
to DM 677 million
vEarnings per ordinary share (after
taxes) reached DM 10.25, achieving
a growth rate of 48% year-on-year
ACQUISITION OF SALOMON
IMPACTS BALANCE SHEET
vAs a result of the acquisition, there
has been a substantial increase in
borrowings, and investments have
risen by the same amount
vAt the same time, financial leverage
increased by 69 percentage points
to 107%
POSITIVE DEVELOPMENTS
IN THE MARKETPLACE
In 1997, the market for sporting goods showed
continuing positive development. Although
exact figures are not yet available for individu-
al countries, there are indications that the
sports shoe market in the United States has
grown by more than 10%. Growth rates in
Europe were probably substantially below
this level. Emerging markets in Asia/Pacific,
due to their strong income levels, were also
performing positively until this development
was abruptly halted with the onset of the
financial and economic crisis. It is safe to
assume, despite all of these uncertainties,
that demand for sporting goods again showed
stronger growth than gross national product
and private consumption worldwide.
SIGNIFICANT GROWTH IN
CONSOLIDATED SALES
In this overall climate, adidas’ net sales in-
creased by DM 2 billion, or 42%, to DM 6.7
billion in 1997. adidas not only gained market
share worldwide but also advanced to be-
come the second-largest sporting goods
company measured by consolidated net
sales. As in the preceding years, this strong
sales performance was primarily driven by
volume growth, with an 18% increase in
footwear pairs and 44% increase in apparel
pieces in 1997.
A smaller proportion of the growth in sales
resulted from the positive effects of an im-
proved product and price mix. Currency
effects, primarily the strength of the US dollar
and pound sterling, contributed 10% to the
growth in sales. In 1997, sales generated
by the joint venture in South Korea were
included for the first time for a full fiscal year.
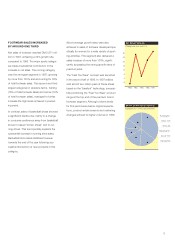
CONTINUED DECREASE
IN LICENSEE SALES
The establishment of new group companies
is, in most circumstances, accompanied by
the termination of former license and/or dis-
tribution agreements. As a consequence, net
sales by licensees continued to decrease as
in 1996, by about 6%, reaching DM 1.3 bil-
lion. These sales, which are not included
in the consolidated company sales, now
account for only 16.2% of total brand sales.
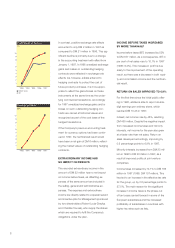
1993 1994 1995 1996 1997
Return on Equity
(%)
50
40
35
30
25
20
15
10
5
nn
n
n
n
nNet income divided by
shareholders’ equity
1993 1994 1995 1996 1997
Total Net Sales of the Brand
(Change year-over-year in %)
50
40
30
20
10
0
– 10
– 20
n
n
n
nadidas
nLicensees
nn
nnn
1993 1994 1995 1996 1997
Income
(DM m)
800
700
600
500
400
300
200
100
10
8
6
4
2
0
nIncome before taxes and minority interests
nNet income nNet income per share (DM)
n
n
n
n
n
n
n