Aarons 2015 Annual Report Download - page 11
Download and view the complete annual report
Please find page 11 of the 2015 Aarons annual report below. You can navigate through the pages in the report by either clicking on the pages listed below, or by using the keyword search tool below to find specific information within the annual report.
Purchasing and Retail Relationships
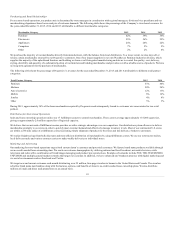
For our store-based operations, our product mix is determined by store managers in consultation with regional managers, divisional vice presidents and our
merchandising department based on an analysis of customer demands. The following table shows the percentage of the Company’s store-based revenues for
the years ended December 31, 2015, 2014 and 2013 attributable to different merchandise categories:
Furniture 42%
39%
36%
Electronics 25%
26%
29%
Appliances 24%
24%
22%
Computers 7%
9%
9%
Other 2%
2%
4%
We purchase the majority of our merchandise directly from manufacturers, with the balance from local distributors. To a lesser extent, we also may sell or
release certain merchandise returned by our Progressive customers. One of our largest suppliers is our own Woodhaven Furniture Industries division, which
supplies the majority of the upholstered furniture and bedding we lease or sell. Integrated manufacturing enables us to control the quality, cost, delivery,
styling, durability and quantity of a substantial portion of our furniture and bedding merchandise and provides us with a reliable source of products. We have
no long-term agreements for the purchase of merchandise.
The following table shows the percentage of Progressive’s revenues for the year ended December 31, 2015 and 2014 attributable to different retail partner
categories:
Furniture 53% 44%
Mattress 20% 24%
Auto electronics 12% 13%
Mobile 8% 12%
Jewelry 4% 4%
Other 3% 3%
During 2015, approximately 34% of the lease merchandise acquired by Progressive and subsequently leased to customers was concentrated in two retail
partners.
Distribution for Store-based Operations
Sales and lease ownership operations utilize our 17 fulfillment centers to control merchandise. These centers average approximately 118,000 square feet,
giving us approximately 2.0 million square feet of logistical capacity.
We believe that our network of fulfillment centers provides us with a strategic advantage over our competitors. Our distribution system allows us to deliver
merchandise promptly to our stores in order to quickly meet customer demand and effectively manage inventory levels. Most of our continental U.S. stores
are within a 250-mile radius of a fulfillment center, facilitating timely shipment of products to the stores and fast delivery of orders to customers.
We realize freight savings from bulk discounts and more efficient distribution of merchandise by using fulfillment centers. We use our own tractor-trailers,
local delivery trucks and various contract carriers to make weekly deliveries to individual stores.
Marketing and Advertising
Our marketing for store-based operations targets both current Aaron’s customers and potential customers. We feature brand name products available through
our no-credit-needed lease ownership plans. We reach our customer demographics by utilizing national and local broadcast, network television, cable
television and radio with a combination of brand/image messaging and product/price promotions. Examples of networks include FOX, TBS, TELEMUNDO,
UNIVISION and multiple general market networks that target our customer. In addition, we have enhanced our broadcast presence with digital marketing and
via social environments such as Facebook and Twitter.
We target new and current customers each month distributing over 29 million, four-page circulars to homes in the United States and Canada. The circulars
advertise brand name merchandise along with the features, options, and benefits of Aaron’s no-credit-needed lease ownership plans. We also distribute
millions of email and direct mail promotions on an annual basis.
10


