Washington Post 2000 Annual Report Download - page 8
Download and view the complete annual report
Please find page 8 of the 2000 Washington Post annual report below. You can navigate through the pages in the report by either clicking on the pages listed below, or by using the keyword search tool below to find specific information within the annual report.-
 1
1 -
 2
2 -
 3
3 -
 4
4 -
 5
5 -
 6
6 -
 7
7 -
 8
8 -
 9
9 -
 10
10 -
 11
11 -
 12
12 -
 13
13 -
 14
14 -
 15
15 -
 16
16 -
 17
17 -
 18
18 -
 19
19 -
20
-
21
-
22
-
23
-
24
-
25
-
26
-
27
-
28
-
29
-
30
-
31
 |
 |

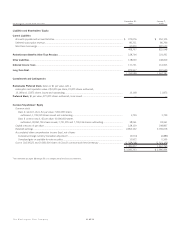
The Washington Post Company
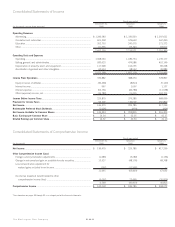
Consolidated Statements of Income
33
Fiscal year ended
December 31, January 2, January 3,
(in thousands, except share amounts) 2000 2000 1999
Operating Revenues
Advertising ..................................................................................................... $ 1,396,583 $ 1,330,560 $ 1,297,621
Circulation and subscriber.............................................................................. 601,258 579,693 547,450
Education....................................................................................................... 352,753 240,075 171,372
Other ............................................................................................................. 61,556 65,243 93,917
2,412,150 2,215,571 2,110,360
Operating Costs and Expenses
Operating ....................................................................................................... 1,308,063 1,189,734 1,139,177
Selling, general, and administrative................................................................. 583,623 474,586 453,149
Depreciation of property, plant, and equipment............................................... 117,948 104,235 89,248
Amortization of goodwill and other intangibles................................................. 62,634 58,563 49,889
2,072,268 1,827,118 1,731,463
Income From Operations ................................................................................... 339,882 388,453 378,897
Equity in losses of affiliates ............................................................................. (36,466) (8,814) (5,140)
Interest income .............................................................................................. 967 1,097 1,137
Interest expense............................................................................................. (54,731) (26,786) (11,538)
Other (expense) income, net .......................................................................... (19,782) 21,435 304,703
Income Before Income Taxes............................................................................. 229,870 375,385 668,059
Provision for Income Taxes ................................................................................ 93,400 149,600 250,800
Net Income........................................................................................................ 136,470 225,785 417,259
Redeemable Preferred Stock Dividends............................................................. (1,026) (950) (956)
Net Income Available for Common Shares ........................................................ $ 135,444 $ 224,835 $ 416,303
Basic Earnings per Common Share.................................................................... $ 14.34 $ 22.35 $ 41.27
Diluted Earnings per Common Share................................................................. $ 14.32 $ 22.30 $ 41.10
Consolidated Statements of Comprehensive Income
Fiscal year ended
December 31, January 2, January 3,
(in thousands) 2000 2000 1999
Net Income........................................................................................................ $ 136,470 $ 225,785 $ 417,259
Other Comprehensive Income (Loss)
Foreign currency translation adjustments........................................................ (1,685) (3,289) (1,136)
Change in net unrealized gain on available-for-sale securities.......................... 13,527 (48,176) 68,768
Less reclassification adjustment for
realized gains included in net income......................................................... (197) (11,995) —
11,645 (63,460) 67,632
Income tax (expense) benefit related to other
comprehensive income (loss) ..................................................................... (5,097) 23,460 (26,819)
6,548 (40,000) 40,813
Comprehensive Income ..................................................................................... $ 143,018 $ 185,785 $ 458,072
The information on pages 38 through 50 is an integral part of the financial statements.