Vtech 2006 Annual Report Download - page 5
Download and view the complete annual report
Please find page 5 of the 2006 Vtech annual report below. You can navigate through the pages in the report by either clicking on the pages listed below, or by using the keyword search tool below to find specific information within the annual report.-
 1
1 -
 2
2 -
 3
3 -
 4
4 -
 5
5 -
 6
6 -
 7
7 -
 8
8 -
 9
9 -
 10
10 -
 11
11 -
 12
12 -
 13
13 -
 14
14 -
 15
15 -
 16
16 -
17
-
18
-
19
-
20
-
21
-
22
-
23
-
24
-
25
-
26
-
27
-
28
-
29
-
30
-
31
-
32
-
33
-
34
-
35
-
36
-
37
-
38
-
39
-
40
-
41
-
42
-
43
-
44
-
45
-
46
-
47
-
48
-
49
-
50
-
51
-
52
-
53
-
54
-
55
-
56
-
57
-
58
-
59
-
60
-
61
 |
 |

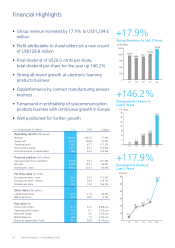
Financial Highlights
VTech Holdings Ltd Annual Report 200602
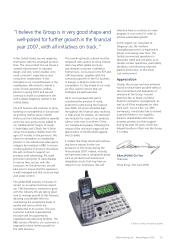
• Group revenue increased by 17.9% to US$1,204.6
million
• Profit attributable to shareholders set a new record
of US$128.8 million
• Final dividend of US26.0 cents per share,
total dividend per share for the year up 146.2%
• Strong all-round growth at electronic learning
products business
• Outperformance by contract manufacturing services
business
• Turnaround in profitability of telecommunication
products business with continuous growth in Europe
• Well positioned for further growth
For the year ended 31st March 2006 2005 Change
Operating results (US$ million)
Revenue 1,204.6 1,022.0 17.9%
Gross profit 446.7 328.8 35.9%
Operating profit 136.2 62.7 117.2%
Profit before taxation 140.1 63.7 119.9%
Profit attributable to shareholders 128.8 56.9 126.4%
Financial position (US$ million)
Cash generated from operations 182.9 60.7 201.3%
Net cash 242.4 123.7 96.0%
Shareholders’ fund 306.2 203.3 50.6%
Per share data (US cents)
Earnings per share – basic 54.9 25.2 117.9%
Earnings per share – diluted 54.3 24.9 118.1%
Dividend per share 32.0 13.0 146.2%
Other data (US$ million)
Capital expenditure 32.1 21.5 49.3%
R&D expenditure 40.3 38.5 4.7%
Key ratios (%)
Gross profit margin 37.1 32.2 4.9% pts
Operating profit margin 11.3 6.1 5.2% pts
Net profit margin 10.7 5.6 5.1% pts
EBITDA/Revenue 12.9 7.9 5.0% pts
Return on shareholders’ fund 42.1 28.0 14.1% pts
0
250
500
750
1,000
1,250
Earnings Per Share in
Last 5 Years
02 03 04 05 06
US cents
+117.9%
Dividends Per Share in
Last 5 Years
02 03 04 05 06
US cents
NIL
3.5
5.0
18.1 20.5
25.2
54.9
10.0
13.0
32.0
+146.2%
+17.9%
Group Revenue in Last 5 Years
US$ million
02 03 04 05 06
959.8
866.5 915.2
1,022.0
1,204.6
0
5
10
15
20
25
30
35
0
10
20
30
40
50
60