Vtech 2006 Annual Report Download - page 12
Download and view the complete annual report
Please find page 12 of the 2006 Vtech annual report below. You can navigate through the pages in the report by either clicking on the pages listed below, or by using the keyword search tool below to find specific information within the annual report.-
 1
1 -
 2
2 -
 3
3 -
 4
4 -
 5
5 -
 6
6 -
 7
7 -
 8
8 -
 9
9 -
 10
10 -
 11
11 -
 12
12 -
 13
13 -
 14
14 -
 15
15 -
 16
16 -
 17
17 -
 18
18 -
 19
19 -
 20
20 -
 21
21 -
 22
22 -
23
-
24
-
25
-
26
-
27
-
28
-
29
-
30
-
31
-
32
-
33
-
34
-
35
-
36
-
37
-
38
-
39
-
40
-
41
-
42
-
43
-
44
-
45
-
46
-
47
-
48
-
49
-
50
-
51
-
52
-
53
-
54
-
55
-
56
-
57
-
58
-
59
-
60
-
61
 |
 |

VTech Holdings Ltd Annual Report 2006 09
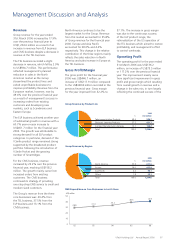
Net Profit and Dividends
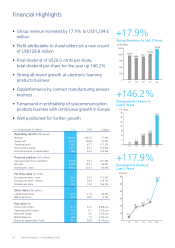
The profit attributable to shareholders
for the year ended 31st March 2006
was US$128.8 million, an increase of
US$71.9 million as compared to the
previous financial year. The ratios of
EBIT and EBITDA to revenue were
11.3% and 12.9% respectively.
Basic earnings per share for the year
ended 31st March 2006 were US54.9
cents as compared to US25.2 cents in
the previous financial year. During the
year, the Group declared and paid an
interim dividend of US6.0 cents per
share, which aggregated to US$14.3
million. The directors have proposed a
final dividend of US26.0 cents per
share, which will aggregate to US$62.1
million. Total dividend for the year
amounted to US32.0 cents per share,
representing an increase of US19.0
cents per share or 146.2% over the
previous financial year.
Liquidity and Financial
Resources
The shareholders’ funds as at
31st March 2006 were US$306.2 million,
a 50.6% increase from US$203.3 million
reported for the financial year 2005. The
net assets per share increased by 42.2%
from US$0.90 to US$1.28.
As at 31st March 2006, the net cash
increased to US$242.4 million, up
96.0% from US$123.7 million at the
previous year-end. The Group is
substantively debt-free, except for an
insignificant amount in the form of a
fixed-interest bearing equipment loan
which is denominated in Euro and
repayable within five years.
Capital Expenditure
For the year ended 31st March 2006,
the Group invested US$32.1 million in
construction of factory buildings,
purchase of plant and machinery,
equipment, computer systems and
other tangible assets. All of these
capital expenditures were financed
from internal resources. During the
financial year 2006, the new
manufacturing plant for the Group in
Qingyuan city, the northern
Guangdong province, started
operation. This plant is specialized in
supplying plastic products for our
TEL business.
Capital Commitments and
Contingencies
The Group expects to invest
approximately US$54 million on capital
expenditure in the financial year 2007.
Besides normal capital expenditure for
ongoing business operations, the
Group decided to establish a new R&D
centre in Shenzhen, Guangdong
province. The centre is expected to be
in operation by the end of the financial
year 2007. In addition, the Group
expects to incur further capital
investment on the new manufacturing
plant in Qingyuan city in the financial
year 2007.
All of these capital expenditures will be
financed from internal resources.
As of the financial year end date, the
Group had no material contingencies.
As at 31st March 2006 and 2005
All figures are in US$ million unless stated otherwise 2006 2005
Stocks 133.8 124.2
Average stocks as a percentage of Group revenue 10.7% 10.8%
Turnover days 81 days 78 days
Trade debtors 162.9 162.3
Average trade debtors as a percentage of Group revenue 13.5% 14.7%
Turnover days 65 days 65 days
As at 31st March 2006 and 2005
All figures are in US$ million unless stated otherwise 2006 2005
Cash 242.4 123.9
Less: Total interest bearing liabilities –(0.2)
Net cash position 242.4 123.7
Gross debts to shareholders’ funds Not applicable 0.1%
Treasury Policies
The objective of the Group’s treasury
policies is to manage its exposure to
fluctuation in foreign currency exchange
rates arising from the Group’s global
operations. It is our policy not to
engage in speculative activities.
Forward foreign exchange contracts
are used to hedge certain exposures.
Working Capital
The stock balance as at 31st March
2006 increased by 7.7% over the
balance at 31st March 2005 to
US$133.8 million. The turnover days
increased from 78 days to 81 days. The
increase in stock level is primarily to
cater for the increased demand for ELPs
and TELs in the first quarter of the
financial year 2007. The trade debtors
balance as at 31st March 2006 was
US$162.9 million, approximately the
same as reported for the previous
financial year. The turnover days were
65 days, the same as in the previous
financial year. Despite higher sales in
the fourth quarter as compared to the
previous financial year, the trade
debtors balance as at 31st March was
maintained at the same level as a result
of substantial debt collection efforts.