Vtech 2006 Annual Report Download - page 11
Download and view the complete annual report
Please find page 11 of the 2006 Vtech annual report below. You can navigate through the pages in the report by either clicking on the pages listed below, or by using the keyword search tool below to find specific information within the annual report.-
 1
1 -
 2
2 -
 3
3 -
 4
4 -
 5
5 -
 6
6 -
 7
7 -
 8
8 -
 9
9 -
 10
10 -
 11
11 -
 12
12 -
 13
13 -
 14
14 -
 15
15 -
 16
16 -
 17
17 -
 18
18 -
 19
19 -
 20
20 -
 21
21 -
 22
22 -
23
-
24
-
25
-
26
-
27
-
28
-
29
-
30
-
31
-
32
-
33
-
34
-
35
-
36
-
37
-
38
-
39
-
40
-
41
-
42
-
43
-
44
-
45
-
46
-
47
-
48
-
49
-
50
-
51
-
52
-
53
-
54
-
55
-
56
-
57
-
58
-
59
-
60
-
61
 |
 |

Management Discussion and Analysis
VTech Holdings Ltd Annual Report 200608
ELP product range and the improved
profitability of the TEL business. In
addition, improvements in operational
efficiency in all three businesses
mitigated the negative impacts from
rising labour costs, high raw
material prices and the appreciation
of Renminbi.
Selling and distribution costs increased
by 14.6% from US$182.6 million in the
previous financial year to US$209.2
million in the financial year 2006. The
increase was mainly attributable to the
increased spending on advertising and
promotional activities particularly to
accommodate the increasing V.Smile
sales. Royalty payments to licensors for
the use of popular cartoon characters
for certain ELPs and V.Smile
Smartridges also increased which was
in line with increase in sales of the
V.Smile product range. Distribution
costs and selling overheads, however,
were maintained at level similar to the
previous financial year despite higher
volume of products sold, owing to the
implementation of an effective cost
control mechanism. The total amount
of selling and distribution costs as
percentage of Group revenue
decreased from 17.9% in the previous
financial year to 17.4% in the financial
year 2006.
Administrative and other operating
expenses increased from US$51.7
million in the previous financial year to
US$61.0 million in the financial year
2006. The increase was mainly due to
an exchange loss of US$2.6 million
recorded because of the depreciation of
the Euro and Sterling against the US
dollar, contrasting with an exchange
gain of US$3.3 million recorded in the
previous financial year. In the previous
financial year, the Group also realised a
gain of US$1.8 million from the
disposal of factories and related entities
in Mexico, whereas no such gain was
recorded in the financial year 2006.
Excluding the effect of exchange
differences and the gain on disposal as
mentioned, the administrative and
other operating expenses increased
only slightly by US$1.6 million
compared to the previous financial year.
Nevertheless, the amount of
administrative and other operating
expenses as percentage of Group
revenue maintained at 5.1% as in the
previous financial year.
Research and development (R&D)
activities are vital for the long-term
development of the Group. During the
financial year 2006, the Group spent
US$40.3 million on research and
development activities, which
represented around 3.3% of total
Group revenue.
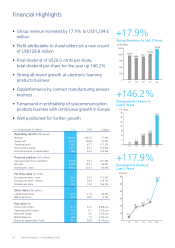
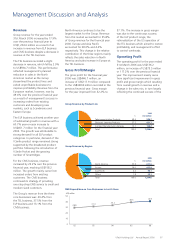
Profit Attributable to Shareholders
in Last 5 Years
US$ million
02 03 04 05 06
11.2
40.8 46.3
56.9
128.8
0
25
50
75
100
125
150
Group EBITDA/Revenue and EBIT/Revenue in Last 5 Years
02 03 04 05 06
6.1
5.4
6.9
2.4
7.9
7.4
9.7
5.9
0
5
10
15 12.9
11.3
EBITDA/Revenue
EBIT/Revenue
%