Vtech 2006 Annual Report Download - page 10
Download and view the complete annual report
Please find page 10 of the 2006 Vtech annual report below. You can navigate through the pages in the report by either clicking on the pages listed below, or by using the keyword search tool below to find specific information within the annual report.-
 1
1 -
 2
2 -
 3
3 -
 4
4 -
 5
5 -
 6
6 -
 7
7 -
 8
8 -
 9
9 -
 10
10 -
 11
11 -
 12
12 -
 13
13 -
 14
14 -
 15
15 -
 16
16 -
 17
17 -
 18
18 -
 19
19 -
 20
20 -
 21
21 -
22
-
23
-
24
-
25
-
26
-
27
-
28
-
29
-
30
-
31
-
32
-
33
-
34
-
35
-
36
-
37
-
38
-
39
-
40
-
41
-
42
-
43
-
44
-
45
-
46
-
47
-
48
-
49
-
50
-
51
-
52
-
53
-
54
-
55
-
56
-
57
-
58
-
59
-
60
-
61
 |
 |

VTech Holdings Ltd Annual Report 2006 07
Management Discussion and Analysis
Revenue
Group revenue for the year ended
31st March 2006 increased by 17.9%
over the previous financial year to
US$1,204.6 million as a result of an
increase in revenue from ELP business
and CMS business despite a decrease in
revenue at the TEL business.
The TEL business recorded a slight
decrease in revenue, which fell by 2.9%
to US$594.7 million. This performance
reflected management’s planned
reduction in sales in the North
American market as the Group
streamlined the product lines and
exited unprofitable businesses to
improve profitability. Revenue from the
European market, however, rose by
49.4% over the previous financial year
as a result of management’s success in
increasing orders from existing
customers and developing new
markets, such as Scandinavia and
Eastern Europe.
The ELP business achieved another year
of substantial growth in revenue with a
60.7% year-on-year increase to
US$451.7 million for the financial year
2006. The growth was attributable to
strong demand for all ELP product
categories. In particular, demand of the
V.Smile product range remained strong
supported by the broadened product
portfolio following the introduction of
V.Smile Pocket and the growing
number of Smartridges.
For the CMS business, revenue
increased by 23.2% over the previous
financial year, reaching US$158.2
million. The growth mainly came from
increased orders from existing
customers. The CMS business
continued its strategy of providing
one-stop shop EMS service to small and
medium sized customers.
The Group’s revenue from the three
core businesses was: 49.4% from
the TEL business, 37.5% from the
ELP business and 13.1% from the
CMS business.
North America continues to be the
largest market for the Group. Revenue
from this market accounted for 55.8%
of Group revenue for the financial year
2006. Europe and Asia Pacific
accounted for 38.0% and 4.4%
respectively. This change in the relative
contribution of the three regions mainly
reflects the sales reduction in North
America and sales increase in Europe at
the TEL business.
Gross Profit/Margin
The gross profit for the financial year
2006 was US$446.7 million, an
increase of US$117.9 million compared
to the US$328.8 million recorded in the
previous financial year. Gross margin
for the year improved from 32.2% to
37.1%. The increase in gross margin
was due to the continuous success
of the ELP product range, the
rationalisation of the US operation of
the TEL business which aimed to restore
profitability, and management’s effort
to control overheads.
Operating Profit
The operating profit for the year ended
31st March 2006 was US$136.2
million, an increase of US$73.5 million
or 117.2% over the previous financial
year. The improvement mainly came
from significant improvement in gross
profit and gross margin which resulting
from overall growth in revenue and a
change in the sales mix, in turn largely
reflecting the continued success of the
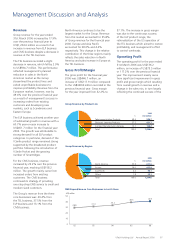
Group Revenue by Product Line
R&D Expenditure on Core Businesses in Last 5 Years
02 03 04 05 06
Telecommunication Products 49.4 594.7
Electronic Learning Products 37.5 451.7
Contract Manufacturing Services 13.1 158.2
Total 100.0 1,204.6
North America 55.8 671.6
Europe 38.0 457.8
Asia Pacific 4.4 53.1
Others 1.8 22.1
Total 100.0
1,204.6
0
10
20
30
40
50
28.9 31.0 33.2
38.5 40.3
Group Revenue by Region
2006
% US$ million
2006
% US$ million
US$ million