Valero 2015 Annual Report Download - page 8
Download and view the complete annual report
Please find page 8 of the 2015 Valero annual report below. You can navigate through the pages in the report by either clicking on the pages listed below, or by using the keyword search tool below to find specific information within the annual report.-
 1
1 -
 2
2 -
 3
3 -
 4
4 -
 5
5 -
 6
6 -
 7
7 -
 8
8 -
 9
9 -
 10
10 -
 11
11 -
 12
12 -
 13
13 -
 14
14 -
 15
15 -
 16
16 -
 17
17 -
 18
18 -
 19
19 -
20
-
21
-
22
-
23
-
24
-
25
-
26
-
27
-
28
-
29
-
30
-
31
-
32
-
33
-
34
-
35
-
36
-
37
-
38
-
39
-
40
-
41
-
42
-
43
-
44
-
45
-
46
-
47
-
48
-
49
-
50
-
51
-
52
-
53
-
54
-
55
-
56
-
57
-
58
-
59
-
60
-
61
-
62
-
63
-
64
-
65
-
66
-
67
-
68
-
69
-
70
-
71
-
72
-
73
-
74
-
75
-
76
-
77
-
78
-
79
-
80
-
81
-
82
-
83
-
84
-
85
-
86
-
87
-
88
-
89
-
90
-
91
-
92
-
93
-
94
-
95
-
96
-
97
-
98
-
99
-
100
-
101
-
102
-
103
-
104
-
105
-
106
-
107
-
108
-
109
-
110
-
111
-
112
-
113
-
114
-
115
-
116
-
117
-
118
-
119
-
120
-
121
-
122
-
123
-
124
-
125
-
126
-
127
-
128
-
129
-
130
-
131
-
132
-
133
-
134
-
135
-
136
-
137
-
138
-
139
-
140
-
141
-
142
-
143
-
144
-
145
-
146
-
147
-
148
-
149
-
150
-
151
-
152
-
153
-
154
-
155
-
156
-
157
-
158
-
159
-
160
-
161
-
162
-
163
-
164
-
165
-
166
-
167
-
168
-
169
-
170
-
171
-
172
-
173
-
174
-
175
-
176
-
177
 |
 |

Table of Contents
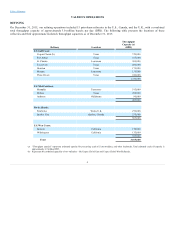
U.S. Mid-Continent
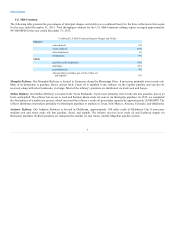
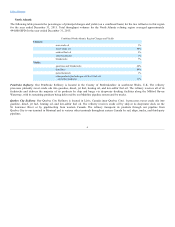
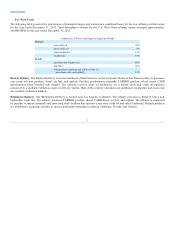
The following table presents the percentages of principal charges and yields (on a combined basis) for the three refineries in this region
for the year ended December 31, 2015. Total throughput volumes for the U.S. Mid-Continent refining region averaged approximately
447,000 BPD for the year ended December 31, 2015.
Combined U.S. Mid-Continent Region Charges and Yields
Charges:
sour crude oil 6%
sweet crude oil 85%
other feedstocks 1%
blendstocks 8%
Yields:
gasolines and blendstocks 54%
distillates 36%
petrochemicals 4%
other products (includes gas oil, No. 6 fuel oil,
and asphalt) 6%
. Our Memphis Refinery is located in Tennessee along the Mississippi River. It processes primarily sweet crude oils.
Most of its production is gasoline, diesel, and jet fuels. Crude oil is supplied to the refinery via the Capline pipeline and can also be
received, along with other feedstocks, via barge. Most of the refinery’s products are distributed via truck rack and barges.
. Our McKee Refinery is located in the Texas Panhandle. It processes primarily sweet crude oils into gasoline, diesel, jet
fuels, and asphalt. The refinery has access to local and Permian Basin crude oil sources via third-party pipelines. In 2015, we completed
the final phases of a multi-year project, which increased the refinery’s crude oil processing capacity by approximately 20,000 BPD. The
refinery distributes its products primarily via third-party pipelines to markets in Texas, New Mexico, Arizona, Colorado, and Oklahoma.
. Our Ardmore Refinery is located in Oklahoma, approximately 100 miles south of Oklahoma City. It processes
medium sour and sweet crude oils into gasoline, diesel, and asphalt. The refinery receives local crude oil and feedstock supply via
third-party pipelines. Refined products are transported to market via rail, trucks, and the Magellan pipeline system.
5