Valero 2015 Annual Report Download - page 10
Download and view the complete annual report
Please find page 10 of the 2015 Valero annual report below. You can navigate through the pages in the report by either clicking on the pages listed below, or by using the keyword search tool below to find specific information within the annual report.-
 1
1 -
 2
2 -
 3
3 -
 4
4 -
 5
5 -
 6
6 -
 7
7 -
 8
8 -
 9
9 -
 10
10 -
 11
11 -
 12
12 -
 13
13 -
 14
14 -
 15
15 -
 16
16 -
 17
17 -
 18
18 -
 19
19 -
 20
20 -
 21
21 -
22
-
23
-
24
-
25
-
26
-
27
-
28
-
29
-
30
-
31
-
32
-
33
-
34
-
35
-
36
-
37
-
38
-
39
-
40
-
41
-
42
-
43
-
44
-
45
-
46
-
47
-
48
-
49
-
50
-
51
-
52
-
53
-
54
-
55
-
56
-
57
-
58
-
59
-
60
-
61
-
62
-
63
-
64
-
65
-
66
-
67
-
68
-
69
-
70
-
71
-
72
-
73
-
74
-
75
-
76
-
77
-
78
-
79
-
80
-
81
-
82
-
83
-
84
-
85
-
86
-
87
-
88
-
89
-
90
-
91
-
92
-
93
-
94
-
95
-
96
-
97
-
98
-
99
-
100
-
101
-
102
-
103
-
104
-
105
-
106
-
107
-
108
-
109
-
110
-
111
-
112
-
113
-
114
-
115
-
116
-
117
-
118
-
119
-
120
-
121
-
122
-
123
-
124
-
125
-
126
-
127
-
128
-
129
-
130
-
131
-
132
-
133
-
134
-
135
-
136
-
137
-
138
-
139
-
140
-
141
-
142
-
143
-
144
-
145
-
146
-
147
-
148
-
149
-
150
-
151
-
152
-
153
-
154
-
155
-
156
-
157
-
158
-
159
-
160
-
161
-
162
-
163
-
164
-
165
-
166
-
167
-
168
-
169
-
170
-
171
-
172
-
173
-
174
-
175
-
176
-
177
 |
 |

Table of Contents
U.S. West Coast
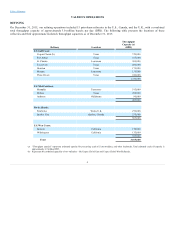
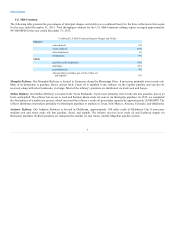
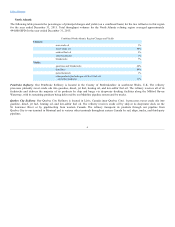
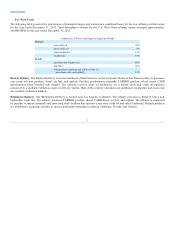
The following table presents the percentages of principal charges and yields (on a combined basis) for the two refineries in this region
for the year ended December 31, 2015. Total throughput volumes for the U.S. West Coast refining region averaged approximately
266,000 BPD for the year ended December 31, 2015.
Combined U.S. West Coast Region Charges and Yields
Charges:
sour crude oil 70%
sweet crude oil 5%
other feedstocks 11%
blendstocks 14%
Yields:
gasolines and blendstocks 60%
distillates 25%
other products (includes gas oil, No. 6 fuel oil,
petroleum coke, and asphalt) 15%
. Our Benicia Refinery is located northeast of San Francisco on the Carquinez Straits of San Francisco Bay. It processes
sour crude oils into gasoline, diesel, jet fuel, and asphalt. Gasoline production is primarily CARBOB gasoline, which meets CARB
specifications when blended with ethanol. The refinery receives crude oil feedstocks via a marine dock and crude oil pipelines
connected to a southern California crude oil delivery system. Most of the refinery’s products are distributed via pipeline and truck rack
into northern California markets.
. Our Wilmington Refinery is located near Los Angeles, California. The refinery processes a blend of heavy and
high-sulfur crude oils. The refinery produces CARBOB gasoline, diesel, CARB diesel, jet fuel, and asphalt. The refinery is connected
by pipeline to marine terminals and associated dock facilities that can move and store crude oil and other feedstocks. Refined products
are distributed via pipeline systems to various third-party terminals in southern California, Nevada, and Arizona.
7