Valero 2015 Annual Report Download - page 6
Download and view the complete annual report
Please find page 6 of the 2015 Valero annual report below. You can navigate through the pages in the report by either clicking on the pages listed below, or by using the keyword search tool below to find specific information within the annual report.-
 1
1 -
 2
2 -
 3
3 -
 4
4 -
 5
5 -
 6
6 -
 7
7 -
 8
8 -
 9
9 -
 10
10 -
 11
11 -
 12
12 -
 13
13 -
 14
14 -
 15
15 -
 16
16 -
 17
17 -
18
-
19
-
20
-
21
-
22
-
23
-
24
-
25
-
26
-
27
-
28
-
29
-
30
-
31
-
32
-
33
-
34
-
35
-
36
-
37
-
38
-
39
-
40
-
41
-
42
-
43
-
44
-
45
-
46
-
47
-
48
-
49
-
50
-
51
-
52
-
53
-
54
-
55
-
56
-
57
-
58
-
59
-
60
-
61
-
62
-
63
-
64
-
65
-
66
-
67
-
68
-
69
-
70
-
71
-
72
-
73
-
74
-
75
-
76
-
77
-
78
-
79
-
80
-
81
-
82
-
83
-
84
-
85
-
86
-
87
-
88
-
89
-
90
-
91
-
92
-
93
-
94
-
95
-
96
-
97
-
98
-
99
-
100
-
101
-
102
-
103
-
104
-
105
-
106
-
107
-
108
-
109
-
110
-
111
-
112
-
113
-
114
-
115
-
116
-
117
-
118
-
119
-
120
-
121
-
122
-
123
-
124
-
125
-
126
-
127
-
128
-
129
-
130
-
131
-
132
-
133
-
134
-
135
-
136
-
137
-
138
-
139
-
140
-
141
-
142
-
143
-
144
-
145
-
146
-
147
-
148
-
149
-
150
-
151
-
152
-
153
-
154
-
155
-
156
-
157
-
158
-
159
-
160
-
161
-
162
-
163
-
164
-
165
-
166
-
167
-
168
-
169
-
170
-
171
-
172
-
173
-
174
-
175
-
176
-
177
 |
 |

Table of Contents
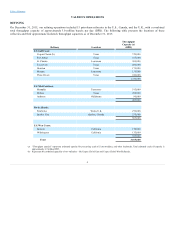
Total Refining System
The following table presents the percentages of principal charges and yields (on a combined basis) for all of our refineries for the year
ended December 31, 2015. Our total combined throughput volumes averaged approximately 2.8 million BPD for the year ended
December 31, 2015.
Combined Total Refining System Charges and Yields
Charges:
sour crude oil 31%
sweet crude oil 43%
residual fuel oil 10%
other feedstocks 5%
blendstocks 11%
Yields:
gasolines and blendstocks 48%
distillates 38%
petrochemicals 3%
other products (includes gas oils, No. 6 fuel oil,
petroleum coke, and asphalt) 11%
U.S. Gulf Coast
The following table presents the percentages of principal charges and yields (on a combined basis) for the eight refineries in this region
for the year ended December 31, 2015. Total throughput volumes for the U.S. Gulf Coast refining region averaged approximately
1.6 million BPD for the year ended December 31, 2015.
Combined U.S. Gulf Coast Region Charges and Yields
Charges:
sour crude oil 40%
sweet crude oil 25%
residual fuel oil 16%
other feedstocks 7%
blendstocks 12%
Yields:
gasolines and blendstocks 46%
distillates 38%
petrochemicals 4%
other products (includes gas oil, No. 6 fuel oil,
petroleum coke, and asphalt) 12%
. Our Corpus Christi East and West Refineries are located on the Texas Gulf Coast along the
Corpus Christi Ship Channel. The East Refinery processes sour crude oil, and the West Refinery processes sweet crude oil, sour crude
oil, and residual fuel oil. In 2015, we completed construction and placed into service a new 70,000 BPD crude distillation unit in the
West Refinery. The feedstocks are delivered by tanker or barge via deepwater docking facilities along the Corpus Christi Ship Channel,
and West Texas or South Texas crude oil is delivered via pipelines. The refineries’ physical locations allow for the transfer of various
feedstocks and blending components between them. The refineries produce gasoline, aromatics, jet fuel, diesel, and asphalt. Truck
racks service local markets for gasoline, diesel, jet
3