Valero 2015 Annual Report Download - page 5
Download and view the complete annual report
Please find page 5 of the 2015 Valero annual report below. You can navigate through the pages in the report by either clicking on the pages listed below, or by using the keyword search tool below to find specific information within the annual report.-
 1
1 -
 2
2 -
 3
3 -
 4
4 -
 5
5 -
 6
6 -
 7
7 -
 8
8 -
 9
9 -
 10
10 -
 11
11 -
 12
12 -
 13
13 -
 14
14 -
 15
15 -
 16
16 -
17
-
18
-
19
-
20
-
21
-
22
-
23
-
24
-
25
-
26
-
27
-
28
-
29
-
30
-
31
-
32
-
33
-
34
-
35
-
36
-
37
-
38
-
39
-
40
-
41
-
42
-
43
-
44
-
45
-
46
-
47
-
48
-
49
-
50
-
51
-
52
-
53
-
54
-
55
-
56
-
57
-
58
-
59
-
60
-
61
-
62
-
63
-
64
-
65
-
66
-
67
-
68
-
69
-
70
-
71
-
72
-
73
-
74
-
75
-
76
-
77
-
78
-
79
-
80
-
81
-
82
-
83
-
84
-
85
-
86
-
87
-
88
-
89
-
90
-
91
-
92
-
93
-
94
-
95
-
96
-
97
-
98
-
99
-
100
-
101
-
102
-
103
-
104
-
105
-
106
-
107
-
108
-
109
-
110
-
111
-
112
-
113
-
114
-
115
-
116
-
117
-
118
-
119
-
120
-
121
-
122
-
123
-
124
-
125
-
126
-
127
-
128
-
129
-
130
-
131
-
132
-
133
-
134
-
135
-
136
-
137
-
138
-
139
-
140
-
141
-
142
-
143
-
144
-
145
-
146
-
147
-
148
-
149
-
150
-
151
-
152
-
153
-
154
-
155
-
156
-
157
-
158
-
159
-
160
-
161
-
162
-
163
-
164
-
165
-
166
-
167
-
168
-
169
-
170
-
171
-
172
-
173
-
174
-
175
-
176
-
177
 |
 |

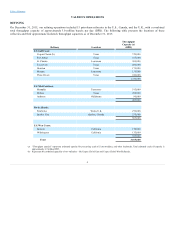
Table of Contents
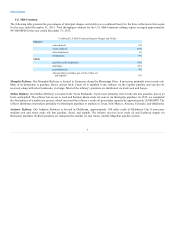
VALERO’S OPERATIONS
REFINING
On December 31, 2015, our refining operations included 15 petroleum refineries in the U.S., Canada, and the U.K., with a combined
total throughput capacity of approximately 3.0 million barrels per day (BPD). The following table presents the locations of these
refineries and their approximate feedstock throughput capacities as of December 31, 2015.
Refinery
Location
Throughput
Capacity (a)
(BPD)
U.S. Gulf Coast:
Corpus Christi (b)
Texas
370,000
Port Arthur
Texas
375,000
St. Charles
Louisiana
305,000
Texas City
Texas
260,000
Houston
Texas
175,000
Meraux
Louisiana
135,000
Three Rivers
Texas
100,000
1,720,000
U.S. Mid-Continent:
Memphis
Tennessee
195,000
McKee
Texas
200,000
Ardmore
Oklahoma
90,000
485,000
North Atlantic:
Pembroke
Wales, U.K.
270,000
Quebec City
Quebec, Canada
235,000
505,000
U.S. West Coast:
Benicia
California
170,000
Wilmington
California
135,000
305,000
Total
3,015,000
(a) “Throughput capacity” represents estimated capacity for processing crude oil, inter-mediates, and other feedstocks. Total estimated crude oil capacity is
approximately 2.5 million BPD.
(b) Represents the combined capacities of two refineries – the Corpus Christi East and Corpus Christi West Refineries.
2