Unum 2012 Annual Report Download - page 5
Download and view the complete annual report
Please find page 5 of the 2012 Unum annual report below. You can navigate through the pages in the report by either clicking on the pages listed below, or by using the keyword search tool below to find specific information within the annual report.-
 1
1 -
 2
2 -
 3
3 -
 4
4 -
 5
5 -
 6
6 -
 7
7 -
 8
8 -
 9
9 -
 10
10 -
 11
11 -
 12
12 -
 13
13 -
 14
14 -
 15
15 -
 16
16 -
17
-
18
-
19
-
20
-
21
-
22
-
23
-
24
-
25
-
26
-
27
-
28
-
29
-
30
-
31
-
32
-
33
-
34
-
35
-
36
-
37
-
38
-
39
-
40
-
41
-
42
-
43
-
44
-
45
-
46
-
47
-
48
-
49
-
50
-
51
-
52
-
53
-
54
-
55
-
56
-
57
-
58
-
59
-
60
-
61
-
62
-
63
-
64
-
65
-
66
-
67
-
68
-
69
-
70
-
71
-
72
-
73
-
74
-
75
-
76
-
77
-
78
-
79
-
80
-
81
-
82
-
83
-
84
-
85
-
86
-
87
-
88
-
89
-
90
-
91
-
92
-
93
-
94
-
95
-
96
-
97
-
98
-
99
-
100
-
101
-
102
-
103
-
104
-
105
-
106
-
107
-
108
-
109
-
110
-
111
-
112
-
113
-
114
-
115
-
116
-
117
-
118
-
119
-
120
-
121
-
122
-
123
-
124
-
125
-
126
-
127
-
128
-
129
-
130
-
131
-
132
-
133
-
134
-
135
-
136
-
137
-
138
-
139
-
140
-
141
-
142
-
143
-
144
-
145
-
146
-
147
-
148
-
149
-
150
-
151
-
152
-
153
-
154
-
155
-
156
-
157
-
158
-
159
-
160
-
161
-
162
-
163
-
164
-
165
-
166
-
167
-
168
 |
 |

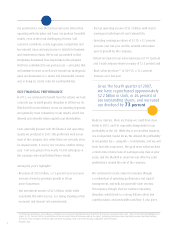
us a great deal of flexibility, which last year was used to
repurchase $500 million of our stock and increase our
dividend by 24 percent. Since the fourth quarter of 2007,
we have repurchased approximately $2.2 billion in stock,
or 26 percent of our outstanding shares, and increased
our dividend by 73 percent.
While I was not satisfied with our stock’s performance last
year, I am very confident that the approach we have taken
to managing the business can continue to create long-term
value for shareholders. Over the last five years, our total
return to shareholders has significantly outperformed our
industry. Steady, profitable growth is something not only
important to investors but also to our rating agencies,
and I am obviously very pleased that both Moody’s and
Standard & Poor’s had the confidence in our company to
upgrade our financial strength ratings in 2012.
Although there are still challenges ahead and more we
wish to accomplish, we were pleased with our performance
this past year and are well-positioned for 2013. Each year
brings its own unique challenges and changes, but what
A CEO’s Perspective on the
Value of Financial Protection
A Message from Tom Watjen
The need for financial protection benefits has
steadily grown as financial foundations have
shifted, government resources have been strained,
and costs have climbed.
When people need them most, benefits such
as disability, accident, critical illness and life
insurance protect against financial hardships that
can derail the stability of individuals and families.
Few people understand that the average worker
has a one in three chance of becoming disabled
from illness or injury for six months or more
during his or her working life. Most of us are
unprepared for the consequences of losing an
income, even for a short period of time.
In fact, 40 percent of working Americans live
paycheck-to-paycheck. Half of all households could
not raise $2,000 within a month if they needed to,
according to the Bureau of Economic Research.
The need for and the value of financial protection
benefits are growing topics of conversation. Over
the last two years, Unum has worked to quantify
the tangible value of disability benefits in particular
and, in the process, built partnerships that can move
us toward the goal of protecting the financial
security of working people and families.
Our industry must continue to do its part by
helping educate consumers about the need
for financial protection and by seeking ways to
simplify our products and make them more
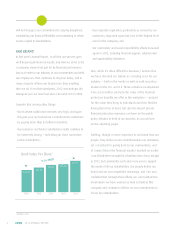
Operating Earnings Per Share
9.3% CAGR
2005 2006 2007
CAGR – Compound Annual Growth Rate.
2008 2009 2010 2011 2012
$1.69 $1.85
$2.25
$2.54 $2.64 $2.73
$2.98 $3.15
Continued on page 5
UNUM 2012 ANNUAL REPORT 3