United Healthcare 2015 Annual Report Download - page 93
Download and view the complete annual report
Please find page 93 of the 2015 United Healthcare annual report below. You can navigate through the pages in the report by either clicking on the pages listed below, or by using the keyword search tool below to find specific information within the annual report.-
 1
1 -
2
-
3
-
4
-
5
-
6
-
7
-
8
-
9
-
10
-
11
-
12
-
13
-
14
-
15
-
16
-
17
-
18
-
19
-
20
-
21
-
22
-
23
-
24
-
25
-
26
-
27
-
28
-
29
-
30
-
31
-
32
-
33
-
34
-
35
-
36
-
37
-
38
-
39
-
40
-
41
-
42
-
43
-
44
-
45
-
46
-
47
-
48
-
49
-
50
-
51
-
52
-
53
-
54
-
55
-
56
-
57
-
58
-
59
-
60
-
61
-
62
-
63
-
64
-
65
-
66
-
67
-
68
-
69
-
70
-
71
-
72
-
73
-
74
-
75
-
76
-
77
-
78
-
79
-
80
-
81
-
82
-
 83
83 -
 84
84 -
 85
85 -
 86
86 -
 87
87 -
 88
88 -
 89
89 -
 90
90 -
 91
91 -
 92
92 -
 93
93 -
 94
94 -
 95
95 -
 96
96 -
 97
97 -
 98
98 -
 99
99 -
 100
100 -
 101
101 -
 102
102 -
 103
103 -
104
-
105
-
106
-
107
-
108
-
109
-
110
-
111
-
112
-
113
 |
 |

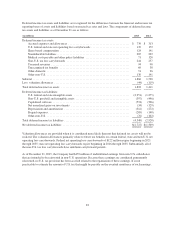
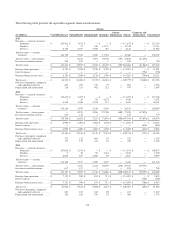
The following table presents the reportable segment financial information:
Optum
(in millions) UnitedHealthcare OptumHealth OptumInsight OptumRx
Optum
Eliminations Optum
Corporate and
Eliminations Consolidated
2015
Revenues — external customers:
Premiums ................. $ 124,011 $ 3,152 $ — $ — $ — $ 3,152 $ — $ 127,163
Products................... 2 31 108 17,171 — 17,310 — 17,312
Services ................... 6,776 2,375 2,390 381 — 5,146 — 11,922
Total revenues — external
customers ................... 130,789 5,558 2,498 17,552 — 25,608 — 156,397
Total revenues — intersegment .... — 8,216 3,697 30,718 (791) 41,840 (41,840) —
Investment and other income ...... 554 153 1 2 — 156 — 710
Total revenues .................. $ 131,343 $ 13,927 $ 6,196 $ 48,272 $ (791) $67,604 $ (41,840) $ 157,107
Earnings from operations ......... $ 6,754 $ 1,240 $ 1,278 $ 1,749 $ — $ 4,267 $ — $ 11,021
Interest expense ................. — — — — — — (790) (790)
Earnings before income taxes ...... $ 6,754 $ 1,240 $ 1,278 $ 1,749 $ — $ 4,267 $ (790) $ 10,231
Total assets .................... $ 64,212 $ 14,600 $ 8,335 $ 26,844 $ — $49,779 $ (2,608) $ 111,383
Purchases of property, equipment
and capitalized software ........ 653 252 572 79 — 903 — 1,556
Depreciation and amortization ..... 718 251 492 232 — 975 — 1,693
2014
Revenues — external customers:
Premiums ................. $ 112,645 $ 2,657 $ — $ — $ — $ 2,657 $ — $ 115,302
Products................... 3 18 96 4,125 — 4,239 — 4,242
Services ................... 6,516 1,300 2,224 111 — 3,635 — 10,151
Total revenues — external
customers ................... 119,164 3,975 2,320 4,236 — 10,531 — 129,695
Total revenues — intersegment .... — 6,913 2,906 27,740 (489) 37,070 (37,070) —
Investment and other income ...... 634 144 1 — — 145 — 779
Total revenues .................. $ 119,798 $ 11,032 $ 5,227 $ 31,976 $ (489) $47,746 $ (37,070) $ 130,474
Earnings from operations ......... $ 6,992 $ 1,090 $ 1,002 $ 1,190 $ — $ 3,282 $ — $ 10,274
Interest expense ................. — — — — — — (618) (618)
Earnings before income taxes ...... $ 6,992 $ 1,090 $ 1,002 $ 1,190 $ — $ 3,282 $ (618) $ 9,656
Total assets .................... $ 62,405 $ 11,148 $ 8,112 $ 5,474 $ — $24,734 $ (757) $ 86,382
Purchases of property, equipment
and capitalized software ........ 773 212 484 56 — 752 — 1,525
Depreciation and amortization ..... 772 179 433 94 — 706 — 1,478
2013
Revenues — external customers:
Premiums ................. $ 107,024 $ 2,533 $ — $ — $ — $ 2,533 $ — $ 109,557
Products................... 8 19 92 3,071 — 3,182 — 3,190
Services ................... 6,076 819 2,006 96 — 2,921 — 8,997
Total revenues — external
customers ................... 113,108 3,371 2,098 3,167 — 8,636 — 121,744
Total revenues — intersegment .... — 6,357 2,615 20,839 (458) 29,353 (29,353) —
Investment and other income ...... 617 127 1 — — 128 — 745
Total revenues .................. $ 113,725 $ 9,855 $ 4,714 $ 24,006 $ (458) $38,117 $ (29,353) $ 122,489
Earnings from operations ......... $ 7,132 $ 949 $ 831 $ 711 $ — $ 2,491 $ — $ 9,623
Interest expense ................. — — — — — — (708) (708)
Earnings before income taxes ...... $ 7,132 $ 949 $ 831 $ 711 $ — $ 2,491 $ (708) $ 8,915
Total assets .................... $ 61,942 $ 9,244 $ 6,880 $ 4,483 $ — $20,607 $ (667) $ 81,882
Purchases of property, equipment
and capitalized software ........ 670 185 363 89 — 637 — 1,307
Depreciation and amortization ..... 766 158 359 92 — 609 — 1,375
91