United Healthcare 2015 Annual Report Download - page 79
Download and view the complete annual report
Please find page 79 of the 2015 United Healthcare annual report below. You can navigate through the pages in the report by either clicking on the pages listed below, or by using the keyword search tool below to find specific information within the annual report.-
 1
1 -
2
-
3
-
4
-
5
-
6
-
7
-
8
-
9
-
10
-
11
-
12
-
13
-
14
-
15
-
16
-
17
-
18
-
19
-
20
-
21
-
22
-
23
-
24
-
25
-
26
-
27
-
28
-
29
-
30
-
31
-
32
-
33
-
34
-
35
-
36
-
37
-
38
-
39
-
40
-
41
-
42
-
43
-
44
-
45
-
46
-
47
-
48
-
49
-
50
-
51
-
52
-
53
-
54
-
55
-
56
-
57
-
58
-
59
-
60
-
61
-
62
-
63
-
64
-
65
-
66
-
67
-
68
-
 69
69 -
 70
70 -
 71
71 -
 72
72 -
 73
73 -
 74
74 -
 75
75 -
 76
76 -
 77
77 -
 78
78 -
 79
79 -
 80
80 -
 81
81 -
 82
82 -
 83
83 -
 84
84 -
 85
85 -
 86
86 -
 87
87 -
 88
88 -
 89
89 -
90
-
91
-
92
-
93
-
94
-
95
-
96
-
97
-
98
-
99
-
100
-
101
-
102
-
103
-
104
-
105
-
106
-
107
-
108
-
109
-
110
-
111
-
112
-
113
 |
 |

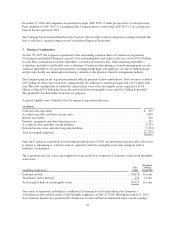
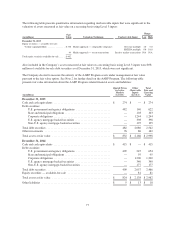
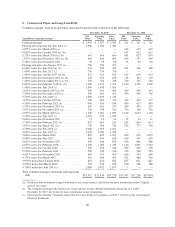
The following table presents quantitative information regarding unobservable inputs that were significant to the
valuation of assets measured at fair value on a recurring basis using Level 3 inputs:
(in millions)
Fair
Value Valuation Technique Unobservable Input
Range
Low High
December 31, 2015
Equity securities — available-for-sale:
Venturecapitalportfolios ............... $358 Marketapproach—comparablecompanies Revenue multiple
EBITDA multiple
1.0
9.0
5.0
10.0
44 Market approach — recent transactions Inactive market transactions N/A N/A
Totalequitysecuritiesavailable-for-sale..... $402
Also included in the Company’s assets measured at fair value on a recurring basis using Level 3 inputs were $98
million of available-for-sale debt securities as of December 31, 2015, which were not significant.
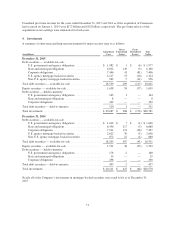
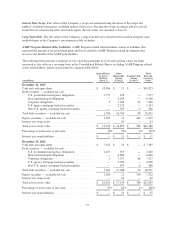
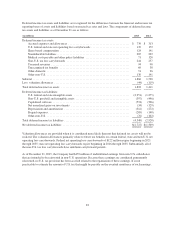
The Company elected to measure the entirety of the AARP Program assets under management at fair value
pursuant to the fair value option. See Note 2 for further detail on the AARP Program. The following table
presents fair value information about the AARP Program-related financial assets and liabilities:
(in millions)
Quoted Prices
in Active
Markets
(Level 1)
Other
Observable
Inputs
(Level 2)
Total
Fair and
Carrying
Value
December 31, 2015
Cash and cash equivalents ........................................ $ 274 $ — $ 274
Debt securities:
U.S. government and agency obligations ........................ 482 140 622
State and municipal obligations ................................ — 103 103
Corporate obligations ........................................ — 1,244 1,244
U.S. agency mortgage-backed securities ......................... — 398 398
Non-U.S. agency mortgage-backed securities ..................... — 195 195
Total debt securities ............................................. 482 2,080 2,562
Other investments .............................................. 76 86 162
Total assets at fair value ......................................... $ 832 $ 2,166 $ 2,998
December 31, 2014
Cash and cash equivalents ........................................ $ 415 $ — $ 415
Debt securities:
U.S. government and agency obligations ........................ 409 245 654
State and municipal obligations ................................ — 95 95
Corporate obligations ........................................ — 1,200 1,200
U.S. agency mortgage-backed securities ......................... — 340 340
Non-U.S. agency mortgage-backed securities ..................... — 177 177
Total debt securities ............................................. 409 2,057 2,466
Equity securities — available-for-sale .............................. — 81 81
Total assets at fair value ......................................... $ 824 $ 2,138 $ 2,962
Other liabilities ................................................ $ 5 $ 13 $ 18
77