United Healthcare 2015 Annual Report Download - page 43
Download and view the complete annual report
Please find page 43 of the 2015 United Healthcare annual report below. You can navigate through the pages in the report by either clicking on the pages listed below, or by using the keyword search tool below to find specific information within the annual report.-
 1
1 -
2
-
3
-
4
-
5
-
6
-
7
-
8
-
9
-
10
-
11
-
12
-
13
-
14
-
15
-
16
-
17
-
18
-
19
-
20
-
21
-
22
-
23
-
24
-
25
-
26
-
27
-
28
-
29
-
30
-
31
-
32
-
 33
33 -
 34
34 -
 35
35 -
 36
36 -
 37
37 -
 38
38 -
 39
39 -
 40
40 -
 41
41 -
 42
42 -
 43
43 -
 44
44 -
 45
45 -
 46
46 -
 47
47 -
 48
48 -
 49
49 -
 50
50 -
 51
51 -
 52
52 -
 53
53 -
54
-
55
-
56
-
57
-
58
-
59
-
60
-
61
-
62
-
63
-
64
-
65
-
66
-
67
-
68
-
69
-
70
-
71
-
72
-
73
-
74
-
75
-
76
-
77
-
78
-
79
-
80
-
81
-
82
-
83
-
84
-
85
-
86
-
87
-
88
-
89
-
90
-
91
-
92
-
93
-
94
-
95
-
96
-
97
-
98
-
99
-
100
-
101
-
102
-
103
-
104
-
105
-
106
-
107
-
108
-
109
-
110
-
111
-
112
-
113
 |
 |

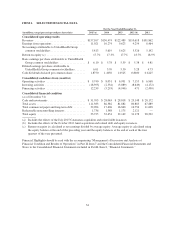
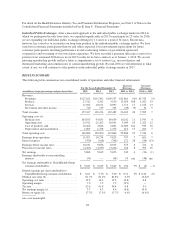
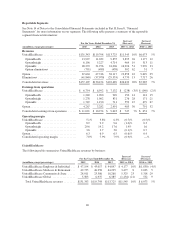
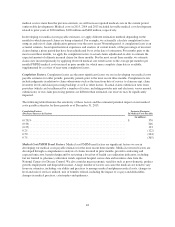
The following table summarizes the number of individuals served by our UnitedHealthcare businesses, by major
market segment and funding arrangement:
December 31,
Increase/
(Decrease)
Increase/
(Decrease)
(in thousands, except percentages) 2015 2014 2013 2015 vs. 2014 2014 vs. 2013
Commercial risk-based ........................... 8,285 7,505 8,185 780 10% (680) (8)%
Commercial fee-based, including TRICARE .......... 21,445 21,245 21,975 200 1 (730) (3)
Total commercial ............................. 29,730 28,750 30,160 980 3 (1,410) (5)
Medicare Advantage ............................. 3,235 3,005 2,990 230 8 15 1
Medicaid ...................................... 5,305 5,055 4,035 250 5 1,020 25
Medicare Supplement (Standardized) ................ 4,035 3,750 3,455 285 8 295 9
Total public and senior ......................... 12,575 11,810 10,480 765 6 1,330 13
Total UnitedHealthcare — domestic medical ........ 42,305 40,560 40,640 1,745 4 (80) —
International ................................... 4,090 4,425 4,805 (335) (8) (380) (8)
Total UnitedHealthcare — medical ............... 46,395 44,985 45,445 1,410 3% (460) (1)%
Supplemental Data:
Medicare Part D stand-alone ..................... 5,060 5,165 4,950 (105) (2)% 215 4%
The increase in commercial risk-based enrollment was the result of strong participation in UnitedHealthcare’s
individual public exchange products and favorable annual renewal activity and new business wins in the
employer group segment. Medicare Advantage participation increased year-over-year primarily due to growth in
people served through employer-sponsored group Medicare Advantage plans. Medicaid growth was driven by
the combination of health reform related Medicaid expansion, states launching new programs to complement
established programs and growth in established programs, partially offset by a decrease of 175,000 people in one
market where an additional offering was introduced by the state in the first quarter of 2015. Medicare
Supplement growth reflected strong customer retention and new sales. The number of people served
internationally decreased year-over-year primarily due to pricing and underwriting disciplines in Brazil in
response to regulatory actions and declining employment levels in Brazil.
UnitedHealthcare’s revenue growth during the year ended December 31, 2015 was due to growth in the number
of individuals served across its businesses and price increases reflecting underlying medical cost trends.
UnitedHealthcare’s operating earnings for the year ended December 31, 2015 decreased as the combined
individual exchange-compliant losses and premium deficiency reserves totaling $815 million more than offset
strong growth across the business, improved medical cost management and increased productivity.
Optum
Total revenues and operating earnings increased for the year ended December 31, 2015 as each reporting
segment increased revenues and earnings from operations by double-digit percentages as a result of the factors
discussed below.
The results by segment were as follows:
OptumHealth
Revenue and earnings from operations increased at OptumHealth during the year ended December 31, 2015
primarily due to growth in its care delivery businesses and the impact of acquisitions in patient care centers and
population health management services. The operating margins for the year ended December 31, 2015 decreased
from the prior year primarily due to investments made to develop future growth opportunities.
41