United Healthcare 2015 Annual Report Download - page 47
Download and view the complete annual report
Please find page 47 of the 2015 United Healthcare annual report below. You can navigate through the pages in the report by either clicking on the pages listed below, or by using the keyword search tool below to find specific information within the annual report.-
 1
1 -
2
-
3
-
4
-
5
-
6
-
7
-
8
-
9
-
10
-
11
-
12
-
13
-
14
-
15
-
16
-
17
-
18
-
19
-
20
-
21
-
22
-
23
-
24
-
25
-
26
-
27
-
28
-
29
-
30
-
31
-
32
-
33
-
34
-
35
-
36
-
 37
37 -
 38
38 -
 39
39 -
 40
40 -
 41
41 -
 42
42 -
 43
43 -
 44
44 -
 45
45 -
 46
46 -
 47
47 -
 48
48 -
 49
49 -
 50
50 -
 51
51 -
 52
52 -
 53
53 -
 54
54 -
 55
55 -
 56
56 -
 57
57 -
58
-
59
-
60
-
61
-
62
-
63
-
64
-
65
-
66
-
67
-
68
-
69
-
70
-
71
-
72
-
73
-
74
-
75
-
76
-
77
-
78
-
79
-
80
-
81
-
82
-
83
-
84
-
85
-
86
-
87
-
88
-
89
-
90
-
91
-
92
-
93
-
94
-
95
-
96
-
97
-
98
-
99
-
100
-
101
-
102
-
103
-
104
-
105
-
106
-
107
-
108
-
109
-
110
-
111
-
112
-
113
 |
 |
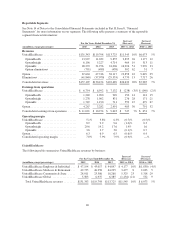
liabilities. These increases were partially offset by an increase in pharmacy rebates, which increased other
receivables, the increase in the payment of the 2015 Health Insurance Industry Tax and the payment of
Reinsurance Program fees in 2015.
Other significant changes in sources or uses of cash year-over-year included increased cash paid for acquisitions
and net debt issuances and decreased share repurchases, all due to the Catamaran acquisition.
2014 Cash Flows Compared to 2013 Cash Flows
Cash flows provided by operating activities in 2014 increased primarily due to an increased level of accounts
payable and other liabilities, including the collection of Reinsurance Program fees in advance of remittance in
2015, partially offset by an increase in government receivables.
Other significant changes in sources or uses of cash year-over-year included: (a) a change in investment activity
from net purchases in 2013 to net sales in 2014; (b) an increase in Part D subsidy receivables causing a change in
customer funds administered; and (c) increased levels of cash used to repurchase common stock.
Financial Condition
As of December 31, 2015, our cash, cash equivalent and available-for-sale investment balances of $31.2 billion
included $10.9 billion of cash and cash equivalents (of which $286 million was available for general corporate
use), $18.6 billion of debt securities and $1.6 billion of investments in equity securities consisting of investments
in non-U.S. dollar fixed-income funds; employee savings plan related investments; venture capital funds; and
dividend paying stocks. Given the significant portion of our portfolio held in cash equivalents, we do not
anticipate fluctuations in the aggregate fair value of our financial assets to have a material impact on our liquidity
or capital position. Other sources of liquidity, primarily from operating cash flows and our commercial paper
program, which is supported by our bank credit facilities, reduce the need to sell investments during adverse
market conditions. See Note 5 of Notes to the Consolidated Financial Statements included in Part II, Item 8,
“Financial Statements” for further detail concerning our fair value measurements.
Our available-for-sale debt portfolio had a weighted-average duration of 3.4 years and a weighted-average credit
rating of “AA” as of December 31, 2015. When multiple credit ratings are available for an individual security,
the average of the available ratings is used to determine the weighted-average credit rating.
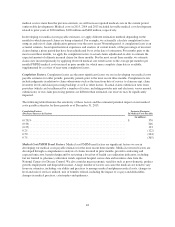
Capital Resources and Uses of Liquidity
In addition to cash flows from operations and cash and cash equivalent balances available for general corporate
use, our capital resources and uses of liquidity are as follows:
Commercial Paper and Bank Credit Facilities. Our revolving bank credit facilities provide liquidity support for
our commercial paper borrowing program, which facilitates the private placement of unsecured debt through
third-party broker-dealers, and are available for general corporate purposes. For more information on our
commercial paper and bank credit facilities, see Note 9 of Notes to the Consolidated Financial Statements
included in Part II, Item 8, “Financial Statements.”
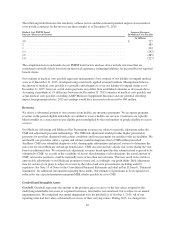
Our revolving bank credit facilities contain various covenants, including covenants requiring us to maintain a
defined debt to debt-plus-stockholders’ equity ratio of not more than 55%. As of December 31, 2015, our debt to
debt-plus-stockholders’ equity ratio, as defined and calculated under the credit facilities was approximately 47%.
Long-Term Debt. Periodically, we access capital markets and issue long-term debt for general corporate
purposes, for example, to meet our working capital requirements, to refinance debt, to finance acquisitions or for
45