Union Pacific 2002 Annual Report Download - page 4
Download and view the complete annual report
Please find page 4 of the 2002 Union Pacific annual report below. You can navigate through the pages in the report by either clicking on the pages listed below, or by using the keyword search tool below to find specific information within the annual report.-
 1
1 -
 2
2 -
 3
3 -
 4
4 -
 5
5 -
 6
6 -
 7
7 -
 8
8 -
 9
9 -
 10
10 -
 11
11 -
 12
12 -
 13
13 -
 14
14 -
 15
15 -
16
-
17
-
18
-
19
-
20
-
21
-
22
-
23
-
24
-
25
-
26
-
27
-
28
-
29
-
30
-
31
-
32
-
33
-
34
-
35
-
36
-
37
-
38
-
39
-
40
-
41
-
42
-
43
-
44
-
45
-
46
-
47
-
48
-
49
-
50
-
51
-
52
-
53
-
54
-
55
-
56
-
57
-
58
-
59
-
60
-
61
-
62
-
63
-
64
-
65
-
66
-
67
-
68
-
69
-
70
-
71
-
72
-
73
-
74
-
75
-
76
-
77
-
78
-
79
-
80
-
81
-
82
-
83
-
84
-
85
-
86
-
87
-
88
-
89
-
90
-
91
-
92
-
93
-
94
-
95
-
96
-
97
-
98
-
99
-
100
-
101
-
102
-
103
-
104
 |
 |

2
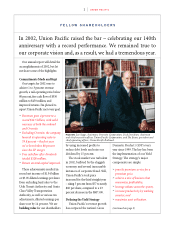
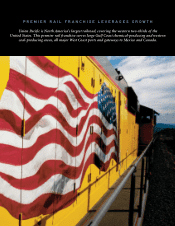
LETTER TO SHAREHOLDERS
In all, our yield strategy is lever-
aging greater value and improved
returns from our superior rail
franchise.
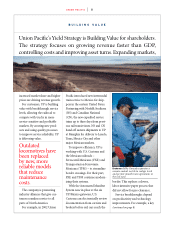
Service Reliability and Efficiency
Service reliability and efficiency
are the linchpins of the yield
strategy. Through a combination
of new product development,
corridor initiatives and alliances,
we’re building service reliability
in an effort to capture market
share from trucks. The economies
of rail beat truck almost every
time. Our challenge is to provide
“truck-like” service and reliability.
We continually work to improve
reliability. We’re narrowing the
service gap and customers are
rewarding us with their business.
Some of the statistics we use to
evaluate our service reached
record levels for the “new” Union
Pacific in 2002: Service Delivery
Index, Train Plan Compliance,
Customer Satisfaction Index and
To/From Industry Compliance.
Our record service performance
was coupled with record business
volumes – transporting 6.1 million
vehicles, 1.5 billion board feet of
lumber, 241 million tons of coal,
32.3 million tons of rock, and nearly
1.6 million international steamship
containers. And, in keeping with
our great history of productivity
improvements, these volumes
were moved with fewer resources.
During a time of increased car-
loadings, cycle-time improvements
actually enabled a 7,000-car
reduction in freight cars on line.
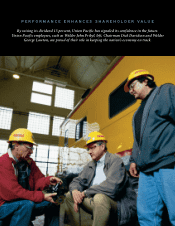
Quality Focus
We’r e building our reputation
as a quality service provider.
During 2002, we became a three-
time winner of Toyota’s
President’s Logistics Award and
DaimlerChrysler’s Gold Award.
UPS Autogistics named us
“Carrier of the Year” for our service
to Ford, and we won GM’s Mark
of Excellence Award and Supplier
of the Year Award. In early 2003,
GM recognized Union Pacific as
one of only eight suppliers, world-
wide, for outstanding service.
Through our Cost of Quality
program, we proactively monitor
the cost of not doing things right
the first time (failure costs). We
work daily to eliminate these
unnecessary expenses. Using
quality and process improve-
ments, we identified failure cost
savings of $133 million in 2002 –
furthering our belief that it costs
less to run a quality company. And,
our quality efforts were recognized
by our selection as a finalist for
the Malcolm Baldrige National
Quality Award for the second
straight year.
Corporate Responsibility
Not only are we raising the bar
operationally, Union Pacific is
also setting itself apart in the cor-
porate governance arena. Over
the past several years, we’ve
adopted corporate governance
“best practices” and we will con-
tinue to examine our policies to
promote effective governance.
(continued on page 4)
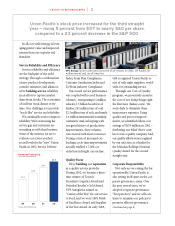
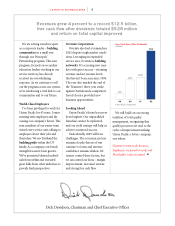
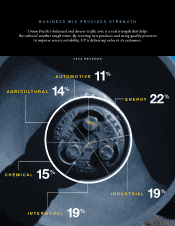
UP’s Energy
business generated 22 percent of all revenue. In 2002, UP hauled 241
million tons of coal, an all-time best.
GTM (MIL) PER EMPLOYEE
Employee Productivity
Union Pacific Railroad
99
17.3
00
18.7
01
20.0
02
21.4
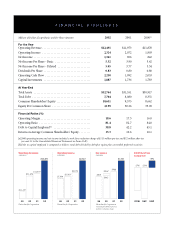
Union Pacific’s stock price increased for the third straight
year – rising 5 percent from $57 to nearly $60 per share,
compared to a 23 percent decrease in the S&P 500.