Union Pacific 2002 Annual Report Download - page 14
Download and view the complete annual report
Please find page 14 of the 2002 Union Pacific annual report below. You can navigate through the pages in the report by either clicking on the pages listed below, or by using the keyword search tool below to find specific information within the annual report.-
 1
1 -
2
-
3
-
 4
4 -
 5
5 -
 6
6 -
 7
7 -
 8
8 -
 9
9 -
 10
10 -
 11
11 -
 12
12 -
 13
13 -
 14
14 -
 15
15 -
 16
16 -
 17
17 -
 18
18 -
 19
19 -
 20
20 -
 21
21 -
 22
22 -
 23
23 -
 24
24 -
25
-
26
-
27
-
28
-
29
-
30
-
31
-
32
-
33
-
34
-
35
-
36
-
37
-
38
-
39
-
40
-
41
-
42
-
43
-
44
-
45
-
46
-
47
-
48
-
49
-
50
-
51
-
52
-
53
-
54
-
55
-
56
-
57
-
58
-
59
-
60
-
61
-
62
-
63
-
64
-
65
-
66
-
67
-
68
-
69
-
70
-
71
-
72
-
73
-
74
-
75
-
76
-
77
-
78
-
79
-
80
-
81
-
82
-
83
-
84
-
85
-
86
-
87
-
88
-
89
-
90
-
91
-
92
-
93
-
94
-
95
-
96
-
97
-
98
-
99
-
100
-
101
-
102
-
103
-
104
 |
 |

12
BUILDING SERVICE
market” strategies. Using integrated
technology, UP provides real-
time data on the status of new
vehicles from the time they leave
the plant until they arrive on the
showroom floor.
UP’s Mid-America and Gulf
Coast corridors realigned operations
to maximize service performance
and asset productivity, particularly
for Chemical traffic in the
southern and central regions.
The result is a better service
product provided at lower cost
using fewer assets.
For the Energy group, the
Overland Corridor track capacity
expansion has increased daily reli-
ability for coal trains departing
Wyoming’s southern Powder
River Basin. The railroad and its
Energy customers are using a new
Web-based, UP-designed “Bulk
Train Planner” computer applica-
tion to better manage daily unit
train operations. Use of this same
technology also has expanded to
manage Agricultural customers’
grain shuttle trains.
The combination of service and
technology has improved the
Service Delivery Index (perform-
ance against commitment) for
coal cycles from 87 in 1999 to 99
in 2002.
Service enhancements in the
West and South boosted Industrial
Products’ lumber and aggregates
revenues. A faster I-5 Corridor
contributed to lumber revenue
growth of 9 percent in 2002 vs.
2001. Local rail car switching
improvements in the South
helped rock revenues grow by 7
percent for the year. Since rail-
roads move less than 10 percent
of the aggregates transportation
market, the economies and effi-
ciencies of unit rock trains –
competing directly against trucks
on quick-turn, short-haul busi-
ness – have great potential.
The Intermodal group con-
tributed top-line growth of nearly
5 percent year over year. Intermodal
is one of UP’s top growth opportu-
nities, aimed at tapping into the
long-haul truck transportation
market. Union Pacific rebounded
quickly from October’s West Coast
ports lock-out, processing and
loading containers as quickly as
steamship customers could clear
the backlog.
n
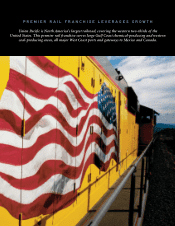
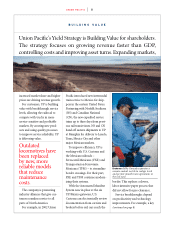
The International Rail Bridge
at Laredo, Texas, is one of four rail bridges UP uses to
cross the Rio Grande River to and from Mexico. In 2002, revenues from UP’s Mexico
business totaled $873 million.
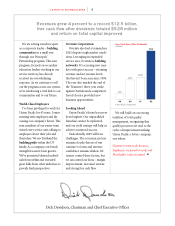
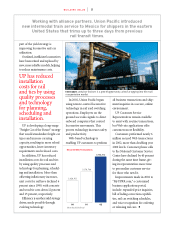
Transporting
80 percent of
all new vehicles
in the western
United States,
Union Pacific
is offering
customers reduced
cycle times.
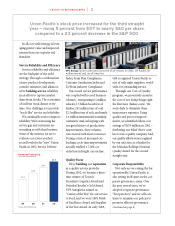
By focusing on service performance corridor by corridor,
Union Pacific has reduced transit times by days. As satisfaction
levels improved in 2002, customers continued to
reward Union Pacific with more of their business.