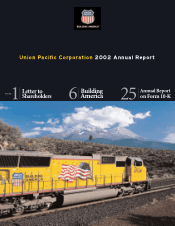
Union Pacific 2002 Annual Report Download - page 2
Download and view the complete annual report
Please find page 2 of the 2002 Union Pacific annual report below. You can navigate through the pages in the report by either clicking on the pages listed below, or by using the keyword search tool below to find specific information within the annual report.-
 1
1 -
 2
2 -
 3
3 -
 4
4 -
 5
5 -
 6
6 -
 7
7 -
 8
8 -
 9
9 -
 10
10 -
 11
11 -
 12
12 -
 13
13 -
14
-
15
-
16
-
17
-
18
-
19
-
20
-
21
-
22
-
23
-
24
-
25
-
26
-
27
-
28
-
29
-
30
-
31
-
32
-
33
-
34
-
35
-
36
-
37
-
38
-
39
-
40
-
41
-
42
-
43
-
44
-
45
-
46
-
47
-
48
-
49
-
50
-
51
-
52
-
53
-
54
-
55
-
56
-
57
-
58
-
59
-
60
-
61
-
62
-
63
-
64
-
65
-
66
-
67
-
68
-
69
-
70
-
71
-
72
-
73
-
74
-
75
-
76
-
77
-
78
-
79
-
80
-
81
-
82
-
83
-
84
-
85
-
86
-
87
-
88
-
89
-
90
-
91
-
92
-
93
-
94
-
95
-
96
-
97
-
98
-
99
-
100
-
101
-
102
-
103
-
104
 |
 |

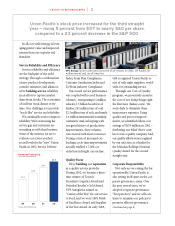
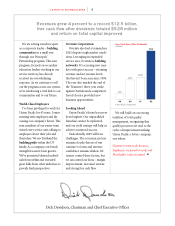
$ MILLIONS
Net Income
Union Pacific Corporation
*excluding $72 million after-tax
work force reduction charge
99 00 01 02
$810
$914*
$842
$966
$1,341
$ MILLIONS
Operating Income
Union Pacific Corporation
99 00 01 02
$1,804 $1,903
$2,072
$2,324
$ MILLIONS
Operating Revenues
Union Pacific Corporation
99 00 01 02
$11,237
$11,878 $11,973
$12,491
2002 Stock Price
Comparison
UNPDOW S&P
-17% -23%
+5%
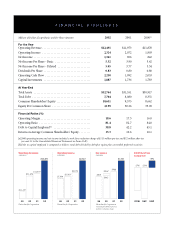
Millions of Dollars, Except Ratios and Per Share Amounts 2002 2001 2000[a]
For the Year
Operating Revenue . . . . . . . . . . . . . . . . . . . . . . . . . . . . . . . . . . $12,491 $11,973 $11,878
Operating Income . . . . . . . . . . . . . . . . . . . . . . . . . . . . . . . . . . 2,324 2,072 1,903
Net Income . . . . . . . . . . . . . . . . . . . . . . . . . . . . . . . . . . . . . . . . 1,341 966 842
Net Income Per Share - Basic . . . . . . . . . . . . . . . . . . . . . . . . . 5.32 3.90 3.42
Net Income Per Share - Diluted . . . . . . . . . . . . . . . . . . . . . . . 5.05 3.77 3.34
Dividends Per Share . . . . . . . . . . . . . . . . . . . . . . . . . . . . . . . . . 0.83 0.80 0.80
Operating Cash Flow . . . . . . . . . . . . . . . . . . . . . . . . . . . . . . . . 2,250 1,992 2,053
Capital Investments . . . . . . . . . . . . . . . . . . . . . . . . . . . . . . . . . 1,887 1,736 1,783
At Year-End
Total Assets . . . . . . . . . . . . . . . . . . . . . . . . . . . . . . . . . . . . . . . . $32,764 $31,551 $30,917
Total Debt . . . . . . . . . . . . . . . . . . . . . . . . . . . . . . . . . . . . . . . . . 7,704 8,080 8,351
Common Shareholders’ Equity . . . . . . . . . . . . . . . . . . . . . . . . 10,651 9,575 8,662
Equity Per Common Share . . . . . . . . . . . . . . . . . . . . . . . . . . . 41.99 38.26 35.09
Financial Ratios (%)
Operating Margin . . . . . . . . . . . . . . . . . . . . . . . . . . . . . . . . . . . 18.6 17.3 16.0
Operating Ratio . . . . . . . . . . . . . . . . . . . . . . . . . . . . . . . . . . . . 81.4 82.7 84.0
Debt to Capital Employed[b] . . . . . . . . . . . . . . . . . . . . . . . . . . 38.8 42.2 45.1
Return on Average Common Shareholders’ Equity . . . . . . . . 13.3 10.6 10.1
[a]2000 operating income and net income included a work force reduction charge of $115 million pre-tax and $72 million after-tax
(see note 13 to the Consolidated Financial Statements in Form 10-K).
[b]Debt to capital employed is computed as follows: total debt divided by debt plus equity plus convertible preferred securities.
FINANCIAL HIGHLIGHTS