Union Pacific 2002 Annual Report Download - page 3
Download and view the complete annual report
Please find page 3 of the 2002 Union Pacific annual report below. You can navigate through the pages in the report by either clicking on the pages listed below, or by using the keyword search tool below to find specific information within the annual report.-
 1
1 -
 2
2 -
 3
3 -
 4
4 -
 5
5 -
 6
6 -
 7
7 -
 8
8 -
 9
9 -
 10
10 -
 11
11 -
 12
12 -
 13
13 -
 14
14 -
15
-
16
-
17
-
18
-
19
-
20
-
21
-
22
-
23
-
24
-
25
-
26
-
27
-
28
-
29
-
30
-
31
-
32
-
33
-
34
-
35
-
36
-
37
-
38
-
39
-
40
-
41
-
42
-
43
-
44
-
45
-
46
-
47
-
48
-
49
-
50
-
51
-
52
-
53
-
54
-
55
-
56
-
57
-
58
-
59
-
60
-
61
-
62
-
63
-
64
-
65
-
66
-
67
-
68
-
69
-
70
-
71
-
72
-
73
-
74
-
75
-
76
-
77
-
78
-
79
-
80
-
81
-
82
-
83
-
84
-
85
-
86
-
87
-
88
-
89
-
90
-
91
-
92
-
93
-
94
-
95
-
96
-
97
-
98
-
99
-
100
-
101
-
102
-
103
-
104
 |
 |

1UNION PACIFIC
Our annual report will detail the
accomplishments of 2002, but let
me share some of the highlights:
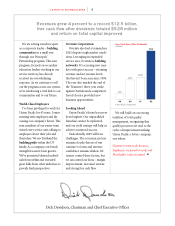
Commitments Made and Kept
Our targets for 2002 were to
achieve 1 to 3 percent revenue
growth, a rail-operating ratio below
80 percent, free cash flow of $350
million to $450 million, and
improved returns. I’m pleased to
report Union Pacific met every goal.
‚
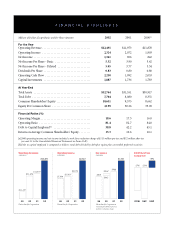
Revenues grew 4 percent to a
record $12.5 billion, with solid
increases at both the railroad
and Overnite.
‚
Excluding Overnite, the company
lowered its operating ratio to
79.8 percent – the first year
we’ve been below 80 percent
since the SP merger.
‚
Free cash flow after dividends
totaled $528 million.
‚
Return on total capital improved.
These achievements resulted in
record net income of $1.34 billion
or $5.05 diluted earnings per share.
Even excluding land sales to the
Utah Transit Authority and Santa
Clara Valley Transportation
Authority, as well as various tax
adjustments, diluted earnings per
share rose by 14 percent. We are
building value for our shareholders
by using increased profits to
reduce debt levels and raise our
dividend by 15 percent.
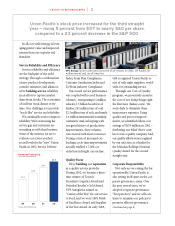
The stock market was turbulent
in 2002, buffeted by the sluggish
economy and several inexcusable
instances of corporate fraud. Still,
Union Pacific’s stock price
increased for the third straight year
– rising 5 percent from $57 to nearly
$60 per share, compared to a 23
percent decrease in the S&P 500.
Defining the Yield Strategy
Union Pacific’s revenue growth
has outpaced the nation’s Gross
Domestic Product (GDP) every
year since 1999. The key has been
the implementation of our Yield
Strategy. The strategy’s major
components are simple:
‚
provide premium service for a
premium price,
‚
achieve a mix of business that
maximizes profitability,
‚
leverage volume across the system,
‚
increase productivity by working
smarter, and
‚
maximize asset utilization.
(continued on page 2)
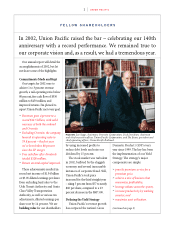
In 2002, Union Pacific raised the bar – celebrating our 140th
anniversary with a record performance. We remained true to
our corporate vision and, as a result, we had a tremendous year.
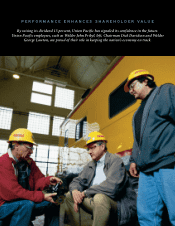
From left,
Leo Suggs, chairman, Overnite Corporation, Dick Davidson, chairman
and chief executive officer, Union Pacific Corporation, and Ike Evans, president and
chief operating officer, Union Pacific Railroad.
FELLOW SHAREHOLDERS