Unilever 2007 Annual Report Download - page 9
Download and view the complete annual report
Please find page 9 of the 2007 Unilever annual report below. You can navigate through the pages in the report by either clicking on the pages listed below, or by using the keyword search tool below to find specific information within the annual report.-
 1
1 -
 2
2 -
 3
3 -
 4
4 -
 5
5 -
 6
6 -
 7
7 -
 8
8 -
 9
9 -
 10
10 -
 11
11 -
 12
12 -
 13
13 -
 14
14 -
 15
15 -
 16
16 -
 17
17 -
 18
18 -
 19
19 -
 20
20 -
21
-
22
-
23
-
24
-
25
-
26
-
27
-
28
-
29
-
30
-
31
-
32
-
33
-
34
-
35
-
36
-
37
-
38
-
39
-
40
-
41
-
42
-
43
-
44
-
45
-
46
-
47
-
48
-
49
-
50
-
51
-
52
-
53
-
54
-
55
-
56
-
57
-
58
-
59
-
60
-
61
-
62
-
63
-
64
-
65
-
66
-
67
-
68
-
69
-
70
-
71
-
72
-
73
-
74
-
75
-
76
-
77
-
78
-
79
-
80
-
81
-
82
-
83
-
84
-
85
-
86
-
87
-
88
-
89
-
90
-
91
-
92
-
93
-
94
-
95
-
96
-
97
-
98
-
99
-
100
-
101
-
102
-
103
-
104
-
105
-
106
-
107
-
108
-
109
-
110
-
111
-
112
-
113
-
114
-
115
-
116
-
117
-
118
-
119
-
120
-
121
-
122
-
123
-
124
-
125
-
126
-
127
-
128
-
129
-
130
-
131
-
132
-
133
-
134
-
135
-
136
-
137
-
138
-
139
-
140
-
141
-
142
-
143
-
144
-
145
-
146
-
147
-
148
 |
 |

Unilever Annual Report and Accounts 2007 7
Report of the Directors continued
About Unilever continued
Our D&E businesses continue to show strong growth, in Asia,
Africa, Central and Eastern Europe and Latin America, and now
make up 44% of our total turnover. Our D&E strategy is focused
on leveraging and further strengthening our existing leading
positions in many D&E markets, such as India and Brazil, as well
as building our brands and business in countries where we
currently have a relatively smaller presence, notably China and
Russia. Our sustained growth is reflecting the strength of our D&E
business model which is characterised by a differentiated portfolio
of strong global and regional brands addressing the needs of the
different income groups, high quality innovation and
communication, scale and depth in distribution, and an excellent
track record and reputation for developing management talent.
Our focus on our best global and regional brands, with increased
investment in advertising and faster roll-out of innovation, has
resulted in a focused portfolio, with 12 brands having a
worldwide turnover in excess of €1 billion and our top 25 brands
collectively delivering 73% of our turnover in 2007.
We also monitor the development of our brands through market
information that gives us insights into our leading positions versus
our direct competitors. In our section on Operating environment
on page 8 below we indicate the product areas in which we have
leading or key strategic positions.
Key indicators – people and sustainability
Unilever has for many years recognised the significance of social
and environmental issues as a critical dimension of its operations,
and has established many indicators to track its performance in
these areas.
We regard safety as an essential element of a successful and
sustainable business and take seriously our responsibility to
provide a safe workplace. We aim to improve continuously the
health, safety and well-being of everyone working for or on
behalf of Unilever to a standard on a par with the very best of our
peers. A key measure of our progress in this area is our total
recordable accident frequency rate which counts all workplace
accidents except those requiring only simple first aid treatment. In
2007 this decreased to 0.26 accidents per 100 000 hours worked,
declining from 0.46 in 2004.
We are committed to meeting the needs of customers and
consumers in an environmentally sound and sustainable
manner, through continuous improvement in environmental
performance in all our activities. We exercise the same concern
for the environment wherever we operate and aim to reduce
the environmental footprint of our business and brands. The
environmental measures that we regard as the most significant in
relation to our business are those relating to the amounts of CO2
from energy that we produce, the water that we consume as part
of our production processes, and the amount of waste that we
generate. We continue to improve our performance across these
measures, having reduced our CO2emissions from energy by
33.5%, our water use by 58.6% and our total waste by 69.3%
per tonne of production over the period 1995 – 2006. In 2007
we set ourselves the further goal of achieving a 25% reduction in
CO2emissions by 2012 (from a 2004 baseline), to give a total
reduction of around 43% since 1995.
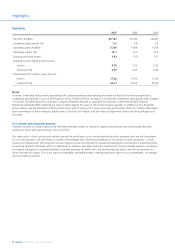
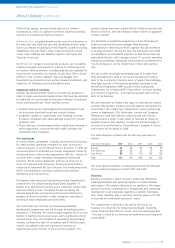
The table below shows the results for these indicators for the last
three years for which independently assured (performed by firms
other than Unilever’s external auditors) data are available:
2006 2005 2004
Total recordable accident frequency rate
per 100 000 hours 0.33 0.39 0.46
CO2 from energy per tonne of
production (kg) 164.59 171.75 185.67
Water per tonne of production (m3) 3.29 3.52 3.67
Total waste per tonne of production (kg) 7.46 8.74 9.79
The type of assurance undertaken has been limited to enquiries of
company personnel and analytical procedures together with
review on a sample basis of the operation of processes relating to
performance data noted in the table above. Assurance of this
nature is substantially less in scope than a financial audit and does
not include detailed sample testing of source data, processes or
internal controls.
A comprehensive review of Unilever’s social and environmental
performance can be found in our annual Sustainable
Development Report, available online at www.unilever.com
Published in May 2008, our next Report will contain updated and
independently assured results for 2007 for the measures above, as
well as trend information that demonstrates our consistent
performance over the longer term.
Please refer also to the Corporate responsibility and sustainability
section on page 12 which highlights a number of key issues and
activities in this area in 2007. Our Operating Review starting on
page 15 also gives examples of the ways in which our brands are
addressing consumers’ social and environmental concerns.
Ten-year trends in many of the measures described above,
together with a range of other indicators, are included in the
document ‘Unilever Charts’ which can be found on our website at
www.unilever.com/ourcompany/investorcentre/annual_reports
Organisation
The three building blocks of our organisation are regions,
categories and functions.
Three regions – Europe, the Americas and Asia Africa – are
responsible for managing Unilever’s business and local market
operations in their regions. They are primarily responsible for
building relationships with customers, managing supply chain
networks, and deploying brands and innovations effectively,
focused on excellent execution in the marketplace. The regions
are accountable for the delivery of in-year financial results
including growth, profits and cash flow, and in-year development
of market shares. The Europe region includes our operations in
Western Europe and Central and Eastern Europe, and in 2007
accounted for approximately 38% of turnover. The Americas
region includes our operations in North America and Latin
America and represented around 33% of turnover. The Asia
Africa region accounted for 29% of turnover, and includes our
operations in the Middle East, Africa, South Asia, South East Asia,
North East Asia and Australasia.
During 2008 changes will be made to the regional structures.
Notably Central and Eastern Europe, will be managed as part of
the Asia Africa region - further concentrating our focus on
emerging markets.