Unilever 2007 Annual Report Download - page 4
Download and view the complete annual report
Please find page 4 of the 2007 Unilever annual report below. You can navigate through the pages in the report by either clicking on the pages listed below, or by using the keyword search tool below to find specific information within the annual report.-
 1
1 -
 2
2 -
 3
3 -
 4
4 -
 5
5 -
 6
6 -
 7
7 -
 8
8 -
 9
9 -
 10
10 -
 11
11 -
 12
12 -
 13
13 -
 14
14 -
 15
15 -
16
-
17
-
18
-
19
-
20
-
21
-
22
-
23
-
24
-
25
-
26
-
27
-
28
-
29
-
30
-
31
-
32
-
33
-
34
-
35
-
36
-
37
-
38
-
39
-
40
-
41
-
42
-
43
-
44
-
45
-
46
-
47
-
48
-
49
-
50
-
51
-
52
-
53
-
54
-
55
-
56
-
57
-
58
-
59
-
60
-
61
-
62
-
63
-
64
-
65
-
66
-
67
-
68
-
69
-
70
-
71
-
72
-
73
-
74
-
75
-
76
-
77
-
78
-
79
-
80
-
81
-
82
-
83
-
84
-
85
-
86
-
87
-
88
-
89
-
90
-
91
-
92
-
93
-
94
-
95
-
96
-
97
-
98
-
99
-
100
-
101
-
102
-
103
-
104
-
105
-
106
-
107
-
108
-
109
-
110
-
111
-
112
-
113
-
114
-
115
-
116
-
117
-
118
-
119
-
120
-
121
-
122
-
123
-
124
-
125
-
126
-
127
-
128
-
129
-
130
-
131
-
132
-
133
-
134
-
135
-
136
-
137
-
138
-
139
-
140
-
141
-
142
-
143
-
144
-
145
-
146
-
147
-
148
 |
 |

2Unilever Annual Report and Accounts 2007
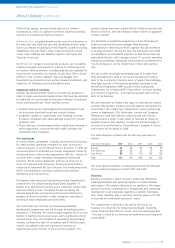
Highlights
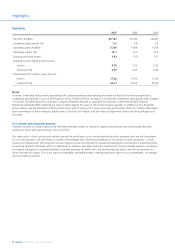
Highlights
2007 2006 2005
Turnover (€ million) 40 187 39 642 38 401
Underlying sales growth (%) 5.5 3.8 3.4
Operating profit (€ million) 5 245 5 408 5 074
Operating margin (%) 13.1 13.6 13.2
Earnings per share (euros) 1.32 1.19 1.07
Dividend per NV ordinary share (euros):
Interim 0.25 0.23 0.22
Proposed final 0.50 0.47 0.44
Dividend per PLC ordinary share (pence):
Interim 17.00 15.62 15.04
Proposed final 34.11 32.04 30.09
Notes
Turnover, underlying sales growth, operating profit, operating margin and earnings per share are based on continuing operations.
Underlying sales growth is not a GAAP measure. In our Financial Review on page 32 we reconcile underlying sales growth with changes
in turnover. Dividend figures for each year comprise dividends declared or proposed for that year. Under International Financial
Reporting Standards (IFRS) dividends are only recorded against the years in which they become payable. In addition to the dividends
shown above, one-off dividends of €0.26 per NV share and 17.66p per PLC share were paid in December 2006. For further information
and commentary on these measures please refer to the Directors’ Report and the Financial Statements within this Annual Report and
Accounts.
Our mission and corporate purpose
Unilever’s mission is to add Vitality to life. We meet everyday needs for nutrition, hygiene and personal care with brands that help
people feel good, look good and get more out of life.
Our deep roots in local cultures and markets around the world give us our strong relationship with consumers and are the foundation
for our future growth. We will bring our wealth of knowledge and international expertise to the service of local consumers – a truly
multi-local multinational. Our long-term success requires a total commitment to exceptional standards of performance and productivity,
to working together effectively, and to a willingness to embrace new ideas and learn continuously. To succeed also requires, we believe,
the highest standards of corporate behaviour towards everyone we work with, the communities we touch, and the environment on
which we have an impact. This is our road to sustainable, profitable growth, creating long-term value for our shareholders, our people,
and our business partners.