Unilever 2007 Annual Report Download - page 8
Download and view the complete annual report
Please find page 8 of the 2007 Unilever annual report below. You can navigate through the pages in the report by either clicking on the pages listed below, or by using the keyword search tool below to find specific information within the annual report.-
 1
1 -
 2
2 -
 3
3 -
 4
4 -
 5
5 -
 6
6 -
 7
7 -
 8
8 -
 9
9 -
 10
10 -
 11
11 -
 12
12 -
 13
13 -
 14
14 -
 15
15 -
 16
16 -
 17
17 -
 18
18 -
 19
19 -
20
-
21
-
22
-
23
-
24
-
25
-
26
-
27
-
28
-
29
-
30
-
31
-
32
-
33
-
34
-
35
-
36
-
37
-
38
-
39
-
40
-
41
-
42
-
43
-
44
-
45
-
46
-
47
-
48
-
49
-
50
-
51
-
52
-
53
-
54
-
55
-
56
-
57
-
58
-
59
-
60
-
61
-
62
-
63
-
64
-
65
-
66
-
67
-
68
-
69
-
70
-
71
-
72
-
73
-
74
-
75
-
76
-
77
-
78
-
79
-
80
-
81
-
82
-
83
-
84
-
85
-
86
-
87
-
88
-
89
-
90
-
91
-
92
-
93
-
94
-
95
-
96
-
97
-
98
-
99
-
100
-
101
-
102
-
103
-
104
-
105
-
106
-
107
-
108
-
109
-
110
-
111
-
112
-
113
-
114
-
115
-
116
-
117
-
118
-
119
-
120
-
121
-
122
-
123
-
124
-
125
-
126
-
127
-
128
-
129
-
130
-
131
-
132
-
133
-
134
-
135
-
136
-
137
-
138
-
139
-
140
-
141
-
142
-
143
-
144
-
145
-
146
-
147
-
148
 |
 |

6Unilever Annual Report and Accounts 2007
Report of the Directors continued
About Unilever
Description of business
Unilever is one of the world’s leading suppliers of fast moving
consumer goods across Foods and Home and Personal Care
categories. Unilever’s portfolio includes some of the world’s best
known and most loved brands.
Strategy and long-term financial targets
At the heart of Unilever's strategy is a concentration of resources
on areas where we have leading category and brand positions
and which offer excellent opportunities for profitable growth,
especially in personal care, developing and emerging markets and
Vitality. The focus is primarily on developing the business
organically, but acquisitions and disposals can also play a role in
accelerating the portfolio development.
To execute this strategy we have reorganised the business to
simplify the organisation and management structure and to
improve capabilities in marketing, customer management, and
research and development. The result is better allocation of
resources, faster decision-making and a lower cost level. This
transformation, known as the One Unilever programme, allows us
to leverage our scale both globally and locally.
Unilever's long-term ambition is to be in the top third of our peer
group in terms of total shareholder return. We expect underlying
sales growth of 3-5% per annum and an operating margin in
excess of 15% by 2010 after a normal level of restructuring
charges of 0.5 to 1 percent of turnover. Return on invested capital
is targeted to increase over the 2004 base of 11%. Over the
period 2005 – 2010, we aim to deliver ungeared free cash flow of
€25-30 billion. It should be noted that previous and planned
disposals and the additional restructuring plans will have reduced
ungeared free cash flow by about €2.5 billion over this period,
while enhancing the ongoing cash generating capacity of the
business.
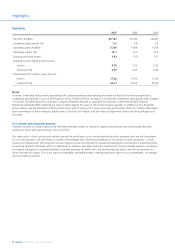
Key indicators – performance and portfolio
These long-term financial targets determine the scope of our key
financial performance indicators. The values for these indicators
for the last three reporting years are as follows:
2007 2006 2005
Underlying sales growth (%) 5.5 3.8 3.4
Operating margin (%) 13.1 13.6 13.2
Ungeared free cash flow (€ billion) 3.8 4.2 4.0
Return on invested capital (%) 12.7 14.6 12.5
Total shareholder return (ranking) 813 14
Underlying sales growth (USG), ungeared free cash flow (UFCF)
and return on invested capital (ROIC) are not recognised measures
under IFRS. The IFRS measure most comparable with USG is
turnover. In our Financial Review on page 32 we reconcile USG
with changes in turnover. There is no IFRS measure directly
comparable with either UFCF or ROIC. In our Financial Review we
reconcile ROIC to net profit, and UFCF to both net profit and cash
flow from operations. The values of turnover, net profit and cash
flow from operating activities for the last three reporting years are
as follows:
€ million € million € million
2007 2006 2005
Turnover 40 187 39 642 38 401
Net profit 4 136 5 015 3 975
Cash flow from operating activities 5 188 5 574 5 924
In 2007, we set out simultaneously to deliver a higher and more
consistent level of underlying sales growth in combination with an
underlying improvement in operating margin. Underlying sales
growth has indeed shown a marked increase to 5.5% in 2007,
driven by better innovation rolled out faster to more countries
and better execution in local markets.
We also achieved an underlying improvement in operating margin
of 0.2 percentage points in 2007, as the combination of volume
leverage, higher prices, cost savings and mix improvement
successfully offset a sharp rise in commodity costs and other
inflation.
Our reported operating margin declined by 0.5 percentage points,
due to a significantly higher level of restructuring charges related
to our plans to accelerate change, which were announced in
August 2007. These plans aim to deliver a reduction in our annual
cost base by around €1.5 billion by the end of 2010, compared
with our 2006 cost base, through the creation of multi-country
organisations (MCOs), the closure or streamlining of 50-60
factories, and a further reduction in regional and global
overheads.
Ungeared free cash flow was €3.8 billion, which was €0.4 billion
lower than a year earlier, including the effect of the higher cash
restructuring costs and increased capital expenditure. Return on
invested capital was 12.7% in 2007. This represented an
improvement from 11.5% in 2006, when adjusted for the profit
on the disposal of frozen foods. Before allowing for this
adjustment, return on invested capital in 2006 was 14.6%.
On our three-year average Total Shareholder Return key
performance measure, which forms part of the basis for top
management remuneration, we remained just outside the top
third of our peer group, although we further improved our
position to the 8th place out of 21 companies.
Further information about these measures, including definitions
and, where appropriate, reconciliation to GAAP measures, can be
found in our Financial Review starting on page 29.
In addition to these financial indicators, we track other measures
in support of our strategic goals. We believe that the share of our
business that is generated in developing and emerging (D&E)
markets, and the proportion of our turnover that is generated by
our top 25 brands are particularly relevant. In the latter context
we group together brands that have a common consumer
proposition and are supported by common innovation
programmes, although in some cases the brand names may vary
between countries. The results for these measures for the last
three reporting years are as follows:
2007 2006 2005
Share of turnover in D&E markets (%) 44 42 40
Share of turnover in top 25 brands (%) 73 73 72