Unilever 2007 Annual Report Download - page 17
Download and view the complete annual report
Please find page 17 of the 2007 Unilever annual report below. You can navigate through the pages in the report by either clicking on the pages listed below, or by using the keyword search tool below to find specific information within the annual report.
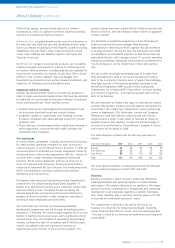
Unilever Annual Report and Accounts 2007 15
Report of the Directors continued
Operating Review – Regions
Basis of reporting
In this Operating Review we comment on our changes in revenue
on the basis of underlying sales growth (USG). This measure
reflects the change in revenue at constant rates of exchange,
(average exchange rates for the preceding year) excluding the
effects of acquisitions and disposals. It is a measure that provides
valuable additional information on the underlying performance
of the business. In particular, it presents the organic growth of
our business year on year and is used internally as a core measure
of sales performance.
USG is not a measure which is defined under IFRS. It should not
be considered in isolation from, or as a substitute for, financial
information presented in compliance with IFRS. This measure as
reported by us may not be comparable with similarly titled
measures reported by other companies.
The reconciliation of USG to changes in turnover for each of our
reporting regions is given in the following section, and for the
Group in total on page 32.
The reporting in this section is based on results for continuing
operations. Information about discontinued operations is given in
note 27 on page 114.
Europe
2007 compared with 2006
€ million € million
2007 2006
Turnover 15 205 15 000
Operating profit 1 678 1 903
Operating margin 11.0% 12.7%
Restructuring, business disposals, impairment charges
and one-time gain (2006) on UK pension
plans included in operating margin (4.0)% (1.4)%
%
Underlying sales growth at constant rates 2.8
Effect of acquisitions 0.0
Effect of disposals (1.5)
Effect of exchange rates 0.0
Turnover growth at current rates 1.4
%
Operating profit 2007 vs 2006
Change at current rates (11.9)
Change at constant rates (11.7)
Turnover at current rates of exchange rose by 1.4%, after the
impact of acquisitions, disposals and exchange rate changes as set
out in the table above. Operating profit at current rates of
exchange fell by 11.9%, after including an adverse currency
movement of 0.2%. The underlying performance of the business
after eliminating these exchange translation effects and the
impact of acquisitions and disposals is discussed below at
constant exchange rates.
The region sustained its improving trend in 2007 with underlying
sales growth of 2.8% for the year. The improvement was driven
by relentless focus on better in-market execution, rejuvenation of
the quality and value of our core products, and an introduction of
new innovations. Consumer demand in our categories was steady
throughout the year.
Overall we saw improving trends almost everywhere. Russia was
the outstanding performer, but all major countries grew in the
year, including the UK, Germany, Italy and the Netherlands. In
France sales were slightly up in a challenging market.
The operating margin, at 11.0% for the year, reflects a higher net
charge for restructuring, disposals and one-off items compared
with 2006. Before these items, the operating margin showed an
underlying improvement of 0.9 percentage points, driven by
lower overheads as a result of the One Unilever programme and
reduced advertising and promotions costs.
We made substantial progress with portfolio development and
restructuring.
At the start of 2008 we completed the expansion of the
successful international partnership for Lipton ready-to-drink tea
with PepsiCo to include all countries in Europe. We also
completed the sale of Boursin, and announced the acquisition of
the leading Russian ice cream company Inmarko.
We formed four new multi-country organisations and announced
the streamlining or closure of ten factories. The roll-out of a single
SAP system across the region continues, with two-thirds of
turnover in the region now on stream and full implementation
expected to be largely completed by the end of 2008.
We continued to target innovations mainly at Vitality
opportunities. In ice cream, we introduced Frusì frozen yoghurt
with wholegrain cereals and real fruit pieces and low calorie
Solero smoothies. Lipton Linea slimming teas were launched in
France, Switzerland and Portugal. Growth in Hellmann’s was
boosted by new extra light mayonnaise with citrus fibre
technology.
The new Dove pro•age range of products is building well in
Europe as well as elsewhere, and Dove Summer Glow self-tanning
and body lotions are now available in most countries. Clear anti-
dandruff shampoo was launched in Russia, with good consumer
response. Small & Mighty concentrated liquid laundry detergents
were launched in seven European countries.


