US Bank 2010 Annual Report Download - page 6
Download and view the complete annual report
Please find page 6 of the 2010 US Bank annual report below. You can navigate through the pages in the report by either clicking on the pages listed below, or by using the keyword search tool below to find specific information within the annual report.-
 1
1 -
 2
2 -
 3
3 -
 4
4 -
 5
5 -
 6
6 -
 7
7 -
 8
8 -
 9
9 -
 10
10 -
 11
11 -
 12
12 -
 13
13 -
 14
14 -
 15
15 -
 16
16 -
 17
17 -
18
-
19
-
20
-
21
-
22
-
23
-
24
-
25
-
26
-
27
-
28
-
29
-
30
-
31
-
32
-
33
-
34
-
35
-
36
-
37
-
38
-
39
-
40
-
41
-
42
-
43
-
44
-
45
-
46
-
47
-
48
-
49
-
50
-
51
-
52
-
53
-
54
-
55
-
56
-
57
-
58
-
59
-
60
-
61
-
62
-
63
-
64
-
65
-
66
-
67
-
68
-
69
-
70
-
71
-
72
-
73
-
74
-
75
-
76
-
77
-
78
-
79
-
80
-
81
-
82
-
83
-
84
-
85
-
86
-
87
-
88
-
89
-
90
-
91
-
92
-
93
-
94
-
95
-
96
-
97
-
98
-
99
-
100
-
101
-
102
-
103
-
104
-
105
-
106
-
107
-
108
-
109
-
110
-
111
-
112
-
113
-
114
-
115
-
116
-
117
-
118
-
119
-
120
-
121
-
122
-
123
-
124
-
125
-
126
-
127
-
128
-
129
-
130
-
131
-
132
-
133
-
134
-
135
-
136
-
137
-
138
-
139
-
140
-
141
-
142
-
143
-
144
-
145
 |
 |

4 U.S. BANCORP
FELLOW SHAREHOLDERS
Differentiating U.S. Bancorp
In 2010, U.S. Bancorp continued to differentiate itself
from its peer banks through its industry leading financial
performance, prudent risk profile, balance sheet and business
line growth, and ongoing investments in the company’s
franchise and future. Thanks to our low-risk operating
model, strong balance sheet and diversified businesses,
U.S. Bancorp has been profitable every single quarter
during the past three years spanning this recession. In fact,
we have further differentiated ourselves by being the only
bank in our peer group to have generated a profit every
quarter for the past 20 years. U.S. Bancorp, again, ended
the year as one of the strongest — if not the strongest
— banks in the industry.
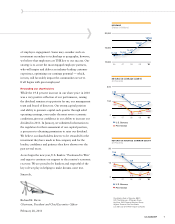
We have made good strategic use of our historic strength
as a conservatively managed, efficient, solid performer
to also successfully evolve and transform our company
into a growth-oriented organization.
Throughout this difficult economic cycle, we have remained
focused on what’s fundamental — and what’s right for
our shareholders, our customers, our employees and our
communities. We are building on our strengths and building
for the future.
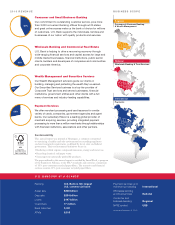
Growth and investment
Over the past two years, we’ve expanded our banking
franchise through FDIC-assisted bank acquisitions and other
branch purchases in California, Arizona, Nevada, Chicago
and, most recently, New Mexico, which represented our
expansion into the 25th contiguous state in our retail
footprint. These are all attractive markets and each acquisi-
tion reflected our strategy of accretive, market fill-in and
expansion to add density and relevant market share to our
franchise. Other business expansion efforts are highlighted
in the following pages, including our growth in corporate
banking, high-grade bond sales, corporate trust, and
payments portfolios, among others. In fact, since 2007, we
have acquired five corporate trust operations and numerous
payments businesses and portfolios. Our capital generation
capabilities and fundamental strength have allowed us to
take advantage of these attractive acquisition opportunities,
as competitors were distracted by internal issues or choosing
to divest.
As the country emerges from the worst of the downturn
and begins to recover, you will see the results from our
recent strategic investments accelerate. We will continue
to pursue strategic acquisition opportunities that meet or
exceed our stringent financial criteria. This is an organiza-
tion focused on sustainable, repeatable and consistent
organic growth and any acquisition will simply represent
an “opportunity not missed.”
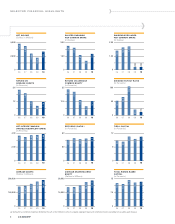
Financial performance
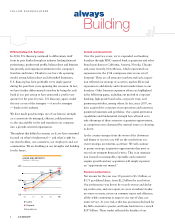
Net income for the year rose 50 percent to $3.3 billion, or
$1.73 per diluted share, from $2.2 billion the year before.
Our performance was driven by record revenue and declin-
ing credit costs, and once again, we were an industry leader
in return on assets, return on common equity and efficiency,
all the while continuing to improve our top-of-class cus-
tomer service. At year end, credit-loss provisions declined for
the fifth consecutive quarter, and loans had risen to a record
$197 billion. These results reflected the benefits of our
06 07 08 09 10
LOANS AND DEPOSITS
(Dollars in Billions)
220
160
100
125 131
159
183
204
125125
2525
55
131131
11
204204
11
131131
11
159159
159159
5959
183183
183183
8383
144
154
185
195
197
Loans
Deposits
Ending balances
Building
always