US Bank 2005 Annual Report Download - page 5
Download and view the complete annual report
Please find page 5 of the 2005 US Bank annual report below. You can navigate through the pages in the report by either clicking on the pages listed below, or by using the keyword search tool below to find specific information within the annual report.-
 1
1 -
 2
2 -
 3
3 -
 4
4 -
 5
5 -
 6
6 -
 7
7 -
 8
8 -
 9
9 -
 10
10 -
 11
11 -
 12
12 -
 13
13 -
 14
14 -
 15
15 -
 16
16 -
17
-
18
-
19
-
20
-
21
-
22
-
23
-
24
-
25
-
26
-
27
-
28
-
29
-
30
-
31
-
32
-
33
-
34
-
35
-
36
-
37
-
38
-
39
-
40
-
41
-
42
-
43
-
44
-
45
-
46
-
47
-
48
-
49
-
50
-
51
-
52
-
53
-
54
-
55
-
56
-
57
-
58
-
59
-
60
-
61
-
62
-
63
-
64
-
65
-
66
-
67
-
68
-
69
-
70
-
71
-
72
-
73
-
74
-
75
-
76
-
77
-
78
-
79
-
80
-
81
-
82
-
83
-
84
-
85
-
86
-
87
-
88
-
89
-
90
-
91
-
92
-
93
-
94
-
95
-
96
-
97
-
98
-
99
-
100
-
101
-
102
-
103
-
104
-
105
-
106
-
107
-
108
-
109
-
110
-
111
-
112
-
113
-
114
-
115
-
116
-
117
-
118
-
119
-
120
-
121
-
122
-
123
-
124
-
125
-
126
-
127
-
128
-
129
-
130
 |
 |

U.S. BANCORP 3
FINANCIAL SUMMARY:
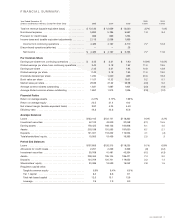
Year Ended December 31 2005 2004
(Dollars and Shares in Millions, Except Per Share Data) 2005 2004 2003 v 2004 v 2003
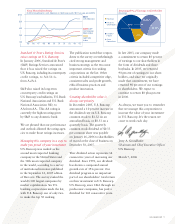
Total net revenue (taxable-equivalent basis) . . . . . . . . . . . . . . $ 13,133 $ 12,659 $ 12,530 3.7% 1.0%
Noninterest expense . . . . . . . . . . . . . . . . . . . . . . . . . . . . . . . . 5,863 5,785 5,597 1.3 3.4
Provision for credit losses . . . . . . . . . . . . . . . . . . . . . . . . . . . . 666 669 1,254
Income taxes and taxable-equivalent adjustments . . . . . . . . . 2,115 2,038 1,969
Income from continuing operations . . . . . . . . . . . . . . . . . . . 4,489 4,167 3,710 7.7 12.3
Discontinued operations (after-tax) . . . . . . . . . . . . . . . . . . . . . — — 23
Net income . . . . . . . . . . . . . . . . . . . . . . . . . . . . . . . . . . . . . . $ 4,489 $ 4,167 $ 3,733 7.7 11.6
Per Common Share
Earnings per share from continuing operations . . . . . . . . . . . . $ 2.45 $ 2.21 $ 1.93 10.9% 14.5%
Diluted earnings per share from continuing operations . . . . . . 2.42 2.18 1.92 11.0 13.5
Earnings per share . . . . . . . . . . . . . . . . . . . . . . . . . . . . . . . . . . 2.45 2.21 1.94 10.9 13.9
Diluted earnings per share . . . . . . . . . . . . . . . . . . . . . . . . . . . . 2.42 2.18 1.93 11.0 13.0
Dividends declared per share . . . . . . . . . . . . . . . . . . . . . . . . . . 1.230 1.020 .855 20.6 19.3
Book value per share . . . . . . . . . . . . . . . . . . . . . . . . . . . . . . . . 11.07 10.52 10.01 5.2 5.1
Market value per share . . . . . . . . . . . . . . . . . . . . . . . . . . . . . . . 29.89 31.32 29.78 (4.6) 5.2
Average common shares outstanding . . . . . . . . . . . . . . . . . . . 1,831 1,887 1,924 (3.0) (1.9)
Average diluted common shares outstanding . . . . . . . . . . . . . 1,857 1,913 1,936 (2.9) (1.2)
Financial Ratios
Return on average assets . . . . . . . . . . . . . . . . . . . . . . . . . . . . . 2.21% 2.17% 1.99%
Return on average equity . . . . . . . . . . . . . . . . . . . . . . . . . . . . . 22.5 21.4 19.2
Net interest margin (taxable-equivalent basis) . . . . . . . . . . . . . 3.97 4.25 4.49
Efficiency ratio . . . . . . . . . . . . . . . . . . . . . . . . . . . . . . . . . . . . . 44.3 45.3 45.6
Average Balances
Loans . . . . . . . . . . . . . . . . . . . . . . . . . . . . . . . . . . . . . . . . . . . . $133,105 $122,141 $118,362 9.0% 3.2%
Investment securities . . . . . . . . . . . . . . . . . . . . . . . . . . . . . . . . 42,103 43,009 37,248 (2.1) 15.5
Earning assets . . . . . . . . . . . . . . . . . . . . . . . . . . . . . . . . . . . . . 178,425 168,123 160,808 6.1 4.5
Assets . . . . . . . . . . . . . . . . . . . . . . . . . . . . . . . . . . . . . . . . . . . . 203,198 191,593 187,630 6.1 2.1
Deposits . . . . . . . . . . . . . . . . . . . . . . . . . . . . . . . . . . . . . . . . . . 121,001 116,222 116,553 4.1 (.3)
Total shareholders’ equity . . . . . . . . . . . . . . . . . . . . . . . . . . . . . 19,953 19,459 19,393 2.5 .3
Period End Balances
Loans . . . . . . . . . . . . . . . . . . . . . . . . . . . . . . . . . . . . . . . . . . . . $137,806 $126,315 $118,235 9.1% 6.8%
Allowance for credit losses . . . . . . . . . . . . . . . . . . . . . . . . . . . . 2,251 2,269 2,369 (.8) (4.2)
Investment securities . . . . . . . . . . . . . . . . . . . . . . . . . . . . . . . . 39,768 41,481 43,334 (4.1) (4.3)
Assets . . . . . . . . . . . . . . . . . . . . . . . . . . . . . . . . . . . . . . . . . . . . 209,465 195,104 189,471 7.4 3.0
Deposits . . . . . . . . . . . . . . . . . . . . . . . . . . . . . . . . . . . . . . . . . . 124,709 120,741 119,052 3.3 1.4
Shareholders’ equity . . . . . . . . . . . . . . . . . . . . . . . . . . . . . . . . . 20,086 19,539 19,242 2.8 1.5
Regulatory capital ratios
Tangible common equity . . . . . . . . . . . . . . . . . . . . . . . . . . . 5.9% 6.4% 6.5%
Tier 1 capital . . . . . . . . . . . . . . . . . . . . . . . . . . . . . . . . . . . . 8.2 8.6 9.1
Total risk-based capital . . . . . . . . . . . . . . . . . . . . . . . . . . . . 12.5 13.1 13.6
Leverage . . . . . . . . . . . . . . . . . . . . . . . . . . . . . . . . . . . . . . . . 7.6 7.9 8.0