US Bank 2005 Annual Report Download - page 4
Download and view the complete annual report
Please find page 4 of the 2005 US Bank annual report below. You can navigate through the pages in the report by either clicking on the pages listed below, or by using the keyword search tool below to find specific information within the annual report.-
 1
1 -
 2
2 -
 3
3 -
 4
4 -
 5
5 -
 6
6 -
 7
7 -
 8
8 -
 9
9 -
 10
10 -
 11
11 -
 12
12 -
 13
13 -
 14
14 -
 15
15 -
16
-
17
-
18
-
19
-
20
-
21
-
22
-
23
-
24
-
25
-
26
-
27
-
28
-
29
-
30
-
31
-
32
-
33
-
34
-
35
-
36
-
37
-
38
-
39
-
40
-
41
-
42
-
43
-
44
-
45
-
46
-
47
-
48
-
49
-
50
-
51
-
52
-
53
-
54
-
55
-
56
-
57
-
58
-
59
-
60
-
61
-
62
-
63
-
64
-
65
-
66
-
67
-
68
-
69
-
70
-
71
-
72
-
73
-
74
-
75
-
76
-
77
-
78
-
79
-
80
-
81
-
82
-
83
-
84
-
85
-
86
-
87
-
88
-
89
-
90
-
91
-
92
-
93
-
94
-
95
-
96
-
97
-
98
-
99
-
100
-
101
-
102
-
103
-
104
-
105
-
106
-
107
-
108
-
109
-
110
-
111
-
112
-
113
-
114
-
115
-
116
-
117
-
118
-
119
-
120
-
121
-
122
-
123
-
124
-
125
-
126
-
127
-
128
-
129
-
130
 |
 |

2U.S. BANCORP
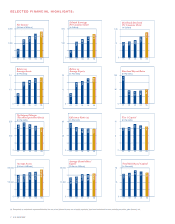
SELECTED FINANCIAL HIGHLIGHTS:
(a) Computed as noninterest expense divided by the sum of net interest income on a taxable-equivalent basis and noninterest income excluding securities gains (losses), net.
4,489
01
5,000
2,500
002 03 04 05
1,479
3,733
4,167
3,168
Net Income
(Dollars in Millions)
1.230
01
1.40
.70
002 03 04 05
.750
.780
.855
1.020
Dividends Declared
Per Common Share
(In Dollars)
2.42
01
3.00
1.50
002 03 04 05
.76
1.65
1.93
2.18
Diluted Earnings
Per Common Share
(In Dollars)
2.21
01
2.4
1.2
002 03 04 05
.89
1.84
1.99
2.17
Return on
Average Assets
(In Percents)
3.97
01
5.00
2.50
002 03 04 05
4.46
4.65
4.49
4.25
Net Interest Margin
(Taxable-Equivalent Basis)
(In Percents)
203,198
01
220,000
110,000
002 03 04 05
165,944
171,948
187,630
191,593
Average Assets
(Dollars in Millions)
22.5
01
24
12
002 03 04 05
9.0
18.3
19.2
21.4
Return on
Average Equity
(In Percents)
44.3
01
60
30
002 03 04 05
57.2
48.8
45.6
45.3
Efficiency Ratio (a)
(In Percents)
19,953
01
25,000
12,500
002 03 04 05
16,426
19,393
19,459
17,273
Average Shareholders’
Equity
(Dollars in Millions)
50.2
01
100
50
002 03 04 05
97.4
47.3
44.1
46.2
Dividend Payout Ratio
(In Percents)
8.2
01
10
5
002 03 04 05
7.8
8.0
9.1
8.6
Tier 1 Capital
(In Percents)
12.5
01
15
7.5
002 03 04 05
11.9
12.4
13.6
13.1
Total Risk-Based Capital
(In Percents)