Toshiba 2015 Annual Report Download - page 15
Download and view the complete annual report
Please find page 15 of the 2015 Toshiba annual report below. You can navigate through the pages in the report by either clicking on the pages listed below, or by using the keyword search tool below to find specific information within the annual report.-
 1
1 -
2
-
3
-
4
-
 5
5 -
 6
6 -
 7
7 -
 8
8 -
 9
9 -
 10
10 -
 11
11 -
 12
12 -
 13
13 -
 14
14 -
 15
15 -
 16
16 -
 17
17 -
 18
18 -
 19
19 -
 20
20 -
 21
21 -
 22
22 -
 23
23 -
 24
24 -
 25
25 -
26
-
27
-
28
-
29
-
30
-
31
-
32
-
33
-
34
-
35
-
36
-
37
-
38
-
39
-
40
-
41
-
42
-
43
-
44
-
45
-
46
-
47
-
48
-
49
-
50
-
51
-
52
-
53
-
54
-
55
-
56
-
57
-
58
-
59
-
60
-
61
-
62
-
63
-
64
-
65
-
66
-
67
-
68
-
69
-
70
 |
 |

Operating income (Billions of yen)
Operating income ratio (%)
Net income (loss) (Billions of yen)
Return on sales (%)
Total equity attributable to shareholders of
Toshiba Corporation (Billions of yen)
Debt/equity ratio (Times)
R&D expenditures (Billions of yen)
R&D/sales ratio (%) Free cash ow (Billions of yen)
Net sales (Billions of yen)
Ratio of overseas sales (%)
FY14FY10 FY11 FY12 FY13 FY14FY10 FY11 FY12 FY13
FY14FY10 FY11 FY12 FY13
FY14FY10 FY11 FY12 FY13
FY14FY10 FY11 FY12 FY13
FY14FY10 FY11 FY12 FY13
Net cash provided by operating activities
Net cash used in investing activities
Free cash ow
54.4 53.7 54.1 58.0
6,264.0 5,996.4 5,722.2
6,489.7 6,655.9
59.3 3.9
1.9 1.6
4.0
244.5
114.9 92.1
257.1
170.4
2.6
2.5
0.1 0.2
0.9
3.2 13.4 –37.8
–0.6
5.1 5.3 5.2 5.1
318.8 319.4 300.0 327.9 352.7
5.3
1.4 1.7 1.8
1.4
793.9 718.7 824.6
1,027.2 1,084.0
1.2
–214.7
–39.7 –64.0
40.0
371.6
156.9
337.5
–377.2
132.3
–196.3
284.1
–244.1
330.4
–190.1
140.3
158.3
60.2
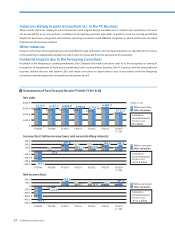
Net sales increased by ¥166.2 billion YoY to ¥6,655.9 billion, reecting
higher sales in the Energy & Infrastructure, Community Solutions
and Electronic Devices & Components segments, despite a decrease
in sales in the Lifestyle Products & Services segment.
Operating income decreased by ¥86.7 billion YoY to ¥170.4 billion, as
a result of impairment losses for discretes business in the Electronic
Devices & Components segments and home appliances business in
the Lifestyle Products & Services segment, while the Energy &
Infrastructure segment recorded higher operating income.
Net income (loss) attributable to shareholders of the Company
decreased by ¥98.0 billion YoY to –¥37.8 billion, due to the eects of
reversal of deferred tax assets on the tax system revision and other
factors.
Equity attributable to the shareholders of the Company was ¥1,084.0
billion, an increase of ¥56.8 billion YoY. This reflects a significant
improvement in the accumulated other comprehensive loss, due to
the continued yen depreciation and a buoyant stock market. The
debt-to-equity ratio was improved YoY to 1.2.
R&D expenditures increased by 8% YoY to ¥352.7 billion, and the R&D
to sales ratio increased to 5.3%.
Free cash ow increased by ¥100.3 billion YoY to ¥140.3 billion, due
to improvement in operating capital as a result of ecient business
operations, and sales of securities.
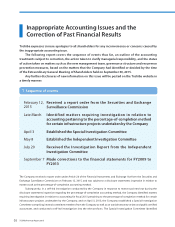
Please see the Data Section from P. 57 for Consolidated Financial Statements.
14
TOSHIBA Annual Report 2015