TiVo 2010 Annual Report Download - page 9
Download and view the complete annual report
Please find page 9 of the 2010 TiVo annual report below. You can navigate through the pages in the report by either clicking on the pages listed below, or by using the keyword search tool below to find specific information within the annual report.-
 1
1 -
 2
2 -
 3
3 -
 4
4 -
 5
5 -
 6
6 -
 7
7 -
 8
8 -
 9
9 -
 10
10 -
 11
11 -
 12
12 -
 13
13 -
 14
14 -
 15
15 -
 16
16 -
 17
17 -
 18
18 -
 19
19 -
 20
20 -
21
-
22
-
23
-
24
-
25
-
26
-
27
-
28
-
29
-
30
-
31
-
32
-
33
-
34
-
35
-
36
-
37
-
38
-
39
-
40
-
41
-
42
-
43
-
44
-
45
-
46
-
47
-
48
-
49
-
50
-
51
 |
 |

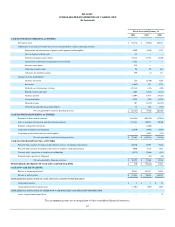
TIVO INC.
CONSOLIDATED STATEMENTS OF OPERATIONS
(In thousands, except per share and share amounts)
Fiscal Year ended January 31,
2011 2010 2009
Revenues
Service revenues $ 140,649 $ 159,772 188,408
Technology revenues 27,341 29,907 20,126
Hardware revenues 51,618 48,787 41,652
Net revenues 219,608 238,466 250,186
Cost of revenues
Cost of service revenues 40,515 40,878 44,603
Cost of technology revenues 18,813 20,703 12,300
Cost of hardware revenues 69,033 65,909 57,742
Total cost of revenues 128,361 127,490 114,645
Gross margin 91,247 110,976 135,541
Research and development 81,604 63,039 62,083
Sales and marketing 27,587 23,270 24,944
Sales and marketing, subscription acquisition costs 8,169 5,048 6,038
General and administrative 59,487 44,801 42,931
Litigation Proceeds — — (87,811)
Total operating expenses 176,847 136,158 48,185
Income (loss) from operations (85,600) (25,182) 87,356
Interest income 1,397 1,039 18,636
Interest expense and other income (expense) (145) 83 (553)
Income (loss) before income taxes (84,348) (24,060) 105,439
Benefit from (provision for) income taxes (164) 1,024 (1,328)
Net income (loss) $ (84,512) $ (23,036) 104,111
Net income (loss) per common share - basic $ (0.74) $ (0.22) $ 1.04
Net income (loss) per common share - diluted $ (0.74) $ (0.22) $ 1.01
Weighted average common shares used to calculate basic net income (loss) per share 113,490,177 106,182,488 100,389,980
Weighted average common shares used to calculate diluted net income (loss) per share 113,490,177 106,182,488 102,595,607
The accompanying notes are an integral part of these consolidated financial statements.
8