TiVo 2010 Annual Report Download - page 20
Download and view the complete annual report
Please find page 20 of the 2010 TiVo annual report below. You can navigate through the pages in the report by either clicking on the pages listed below, or by using the keyword search tool below to find specific information within the annual report.-
 1
1 -
2
-
3
-
4
-
5
-
6
-
7
-
8
-
9
-
 10
10 -
 11
11 -
 12
12 -
 13
13 -
 14
14 -
 15
15 -
 16
16 -
 17
17 -
 18
18 -
 19
19 -
 20
20 -
 21
21 -
 22
22 -
 23
23 -
 24
24 -
 25
25 -
 26
26 -
 27
27 -
 28
28 -
 29
29 -
 30
30 -
31
-
32
-
33
-
34
-
35
-
36
-
37
-
38
-
39
-
40
-
41
-
42
-
43
-
44
-
45
-
46
-
47
-
48
-
49
-
50
-
51
 |
 |

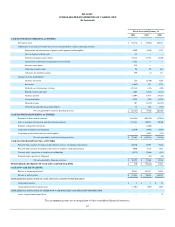
January 31, 2011 January 31, 2010
(in thousands)
Due within 1 year $ 123,631 $ 141,857
Due within 1 year through 5 years 14,585 31,834
Due within 5 years through 10 years — —
Due after 10 years 2,490 4,112
Total $ 140,706 $ 177,803
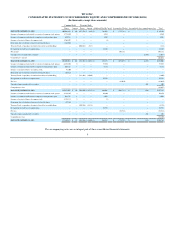
Unrealized Gains (Losses) on Marketable Investment Securities
The following table summarizes unrealized gains and losses related to the Company’s investments in marketable securities designated as available-for-
sale:
As of January 31, 2011
Adjusted
Cost Gross
Unrealized
Gains
Gross
Unrealized
Losses
Fair
Value
(in thousands)
Certificate of deposit $ 25,600 $ 7 $ — $ 25,607
Commercial paper 24,471 2 — 24,473
Corporate debt securities 42,847 50 — 42,897
US agency securities 23,074 11 (2) 23,083
US Treasury securities 5,009 14 — 5,023
Foreign government securities 12,030 5 — 12,035
Variable-rate demand notes 2,600 — — 2,600
Asset-backed securities 2,499 — (1) 2,498
Auction rate securities 3,000 — (510) 2,490
Total $ 141,130 $ 89 $ (513) $ 140,706
As of January 31, 2010
Adjusted
Cost Gross
Unrealized
Gains
Gross
Unrealized
Losses
Fair
Value
(in thousands)
Certificate of deposit $ 16,408 $ — $ (7) $ 16,401
Commercial paper 39,547 12 — 39,559
Corporate debt securities 49,743 134 (44) 49,833
US agency securities 26,958 40 — 26,998
US Treasury securities 15,065 48 — 15,113
Foreign government securities 25,708 79 — 25,787
Auction rate securities 5,000 — (888) 4,112
Total $ 178,429 $ 313 (939) $ 177,803
The available-for-sale investments that were in an unrealized loss position as of January 31, 2011 and January 31, 2010 , aggregated by length of time
that individual securities have been in a continuous loss position, were as follows:
19