TD Bank 2012 Annual Report Download - page 4
Download and view the complete annual report
Please find page 4 of the 2012 TD Bank annual report below. You can navigate through the pages in the report by either clicking on the pages listed below, or by using the keyword search tool below to find specific information within the annual report.-
 1
1 -
 2
2 -
 3
3 -
 4
4 -
 5
5 -
 6
6 -
 7
7 -
 8
8 -
 9
9 -
 10
10 -
 11
11 -
 12
12 -
 13
13 -
 14
14 -
 15
15 -
16
-
17
-
18
-
19
-
20
-
21
-
22
-
23
-
24
-
25
-
26
-
27
-
28
-
29
-
30
-
31
-
32
-
33
-
34
-
35
-
36
-
37
-
38
-
39
-
40
-
41
-
42
-
43
-
44
-
45
-
46
-
47
-
48
-
49
-
50
-
51
-
52
-
53
-
54
-
55
-
56
-
57
-
58
-
59
-
60
-
61
-
62
-
63
-
64
-
65
-
66
-
67
-
68
-
69
-
70
-
71
-
72
-
73
-
74
-
75
-
76
-
77
-
78
-
79
-
80
-
81
-
82
-
83
-
84
-
85
-
86
-
87
-
88
-
89
-
90
-
91
-
92
-
93
-
94
-
95
-
96
-
97
-
98
-
99
-
100
-
101
-
102
-
103
-
104
-
105
-
106
-
107
-
108
-
109
-
110
-
111
-
112
-
113
-
114
-
115
-
116
-
117
-
118
-
119
-
120
-
121
-
122
-
123
-
124
-
125
-
126
-
127
-
128
-
129
-
130
-
131
-
132
-
133
-
134
-
135
-
136
-
137
-
138
-
139
-
140
-
141
-
142
-
143
-
144
-
145
-
146
-
147
-
148
-
149
-
150
-
151
-
152
-
153
-
154
-
155
-
156
-
157
-
158
-
159
-
160
-
161
-
162
-
163
-
164
-
165
-
166
-
167
-
168
-
169
-
170
-
171
-
172
-
173
-
174
-
175
-
176
-
177
-
178
-
179
-
180
-
181
-
182
-
183
-
184
-
185
-
186
-
187
-
188
-
189
-
190
-
191
-
192
-
193
-
194
-
195
-
196
 |
 |

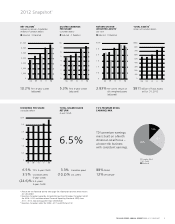
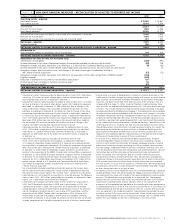
2TD BANK GROUP ANNUAL REPORT 2012 YEAR AT A GLANCE
Key Financial Metrics
(millions of Canadian dollars, except where noted) 2012 2011
Results of operations
Total revenue – reported $23,122 $21,662
Total revenue – adjusted 23,253 21,535
Net income – reported 6,471 6,045
Net income – adjusted 7,075 6,432
Financial positions at year-end
Total assets $B 811.1 735.5
Total deposits $B 487.8 449.4
Total loans net of allowance for loan losses $B 408.8 377.2
Per common share (Canadian dollars)
Diluted earnings – reported 6.76 6.43
Diluted earnings – adjusted 7.42 6.86
Dividend payout ratio – adjusted 38.7% 37.7%
Closing market price (fiscal year end) 81.23 75.23
Total shareholder return (1 year) 11.9% 5.7%
Financial ratios
Tier 1 capital ratio4 12.6% 13.0%
Total capital ratio4 15.7% 16.0%
Efficiency ratio – reported 60.5% 60.2%
Efficiency ratio – adjusted 56.6% 57.5%
1
Results prepared in accordance with GAAP are referred to as “reported.” Adjusted
results (excluding “items of note,” net of tax, from reported results) and related
terms are not defined terms under GAAP and, therefore, may not be comparable to
similar terms used by other issuers. See “How the Bank Reports” in the accompa-
nying Management’s Discussion and Analysis (MD&A) for further explanation, a list
of the items of note and a reconciliation of non-GAAP financial measures.
The Bank transitioned from Canadian GAAP to IFRS effective November 1, 2011.
The Bank’s financial results for fiscal 2011 have been presented in accordance with
IFRS for comparative purposes in the Bank’s 2012 Annual Consolidated Financial
Statements and Management’s Discussion and Analysis (MD&A) (unless otherwise
noted). Accordingly, the calculation of growth rates include balances in accordance
with Canadian GAAP for the 2007 to 2010 financial years and balances in accor-
dance with IFRS for 2011 and 2012.
“ Five-year CAGR” is the compound annual growth rate calculated from 2007 to
2012 on an adjusted basis.
“TD’s Premium Retail Earnings Mix” is based on adjusted results.
“ Canadian Retail” earnings are the total adjusted earnings of the Canadian Personal
and Commercial Banking and Wealth and Insurance segments. “U.S. Retail” earnings
are the total adjusted earnings of U.S. Personal and Commercial Banking segment
and TD Ameritrade Holding Corporation pickup.
Canadian peers/Big Five Canadian Banks include Royal Bank of Canada, Scotiabank,
Bank of Montreal and Canadian Imperial Bank of Commerce.
U.S. peers include Citigroup, Bank of America, J.P. Morgan, Wells Fargo, PNC
Financial and U.S. Bancorp.
For purposes of comparison with U.S. peers, dividends per share five-year compound
growth rate is calculated on a year-to-date basis from Q3 2007 to Q3 2012.
2
Big Five Canadian Banks based on Bloomberg for the period ended Oct. 31, 2012.
Please note TD is tied for first with respect to the 3 year CAGR.
3
TD Canada Trust received the highest numerical score among the big five retail
banks in the proprietary J.D. Power and Associates 2012 Canadian Retail Banking
Customer Satisfaction StudySM
. Study based on 11,764 total responses. Proprietary
study results are based on experiences and perceptions of consumers, and fielding
was completed in two waves between February and May 2012. Your experiences
may vary. Visit jdpower.com
4
In fiscal 2011, capital ratios are calculated based on Canadian GAAP.
TD had the highest
Total Shareholder Returns
(TSR) among Big Five
Canadian Banks
for the 3, 5 and 10 year time periods.
2
TD Bank, America’s
Most Convenient Bank,
®
grows store network
opening its 1,300th store; U.S. Personal
and Commercial Banking has the
11th largest store network in the U.S.
TD increased its target
dividend payout range to
40
–
50% from 35
–
45%
and raised dividends twice
during fiscal 2012.
TD continued to invest
in its growth businesses
announcing a deal to acquire Target’s
U.S. Credit Card portfolio and enjoying
market share gains in domestic
commercial banking in fiscal 2012.
Our retail operations posted
a record $6.2 billion
in adjusted earnings for 2012 or 88%
of operating segment earnings.
TD Asset Management
hits milestone
$200 billion in assets under
management despite volatile
markets in fiscal 2012.
TD Securities achieved
a strong Return on Equity
(ROE) of over 21%
despite tentative markets in fiscal 2012.
TD Insurance’s total premiums
exceeded $3 billion for the
third consecutive year
and TD Insurance remains the
#1 direct writer of home and
auto insurance in Canada.
TD Canada Trust
named Highest in
Customer Satisfaction
among the Big Five Retail Banks
for the seventh year in a row.3
Year at a Glance1