TD Bank 2012 Annual Report Download - page 18
Download and view the complete annual report
Please find page 18 of the 2012 TD Bank annual report below. You can navigate through the pages in the report by either clicking on the pages listed below, or by using the keyword search tool below to find specific information within the annual report.-
 1
1 -
2
-
3
-
4
-
5
-
6
-
7
-
 8
8 -
 9
9 -
 10
10 -
 11
11 -
 12
12 -
 13
13 -
 14
14 -
 15
15 -
 16
16 -
 17
17 -
 18
18 -
 19
19 -
 20
20 -
 21
21 -
 22
22 -
 23
23 -
 24
24 -
 25
25 -
 26
26 -
 27
27 -
 28
28 -
29
-
30
-
31
-
32
-
33
-
34
-
35
-
36
-
37
-
38
-
39
-
40
-
41
-
42
-
43
-
44
-
45
-
46
-
47
-
48
-
49
-
50
-
51
-
52
-
53
-
54
-
55
-
56
-
57
-
58
-
59
-
60
-
61
-
62
-
63
-
64
-
65
-
66
-
67
-
68
-
69
-
70
-
71
-
72
-
73
-
74
-
75
-
76
-
77
-
78
-
79
-
80
-
81
-
82
-
83
-
84
-
85
-
86
-
87
-
88
-
89
-
90
-
91
-
92
-
93
-
94
-
95
-
96
-
97
-
98
-
99
-
100
-
101
-
102
-
103
-
104
-
105
-
106
-
107
-
108
-
109
-
110
-
111
-
112
-
113
-
114
-
115
-
116
-
117
-
118
-
119
-
120
-
121
-
122
-
123
-
124
-
125
-
126
-
127
-
128
-
129
-
130
-
131
-
132
-
133
-
134
-
135
-
136
-
137
-
138
-
139
-
140
-
141
-
142
-
143
-
144
-
145
-
146
-
147
-
148
-
149
-
150
-
151
-
152
-
153
-
154
-
155
-
156
-
157
-
158
-
159
-
160
-
161
-
162
-
163
-
164
-
165
-
166
-
167
-
168
-
169
-
170
-
171
-
172
-
173
-
174
-
175
-
176
-
177
-
178
-
179
-
180
-
181
-
182
-
183
-
184
-
185
-
186
-
187
-
188
-
189
-
190
-
191
-
192
-
193
-
194
-
195
-
196
 |
 |

TD BANK GROUP ANNUAL REPORT 2012 MANAGEMENT’S DISCUSSION AND ANALYSIS16
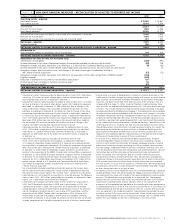
(millions of Canadian dollars) 2012 vs. 2011
2012 2011 % change
Investment and securities services
TD Waterhouse fees and commissions $ 384 $ 459 (16.3)%
Full-service brokerage and other securities services 562 631 (10.9)
Underwriting and advisory 437 378 15.6
Investment management fees 241 215 12.1
Mutual funds management 997 941 6.0
Total investment and securities services 2,621 2,624 (0.1)
Credit fees 745 671 11.0
Net gains (losses) from available-for-sale securities 373 393 (5.1)
Trading income (loss) (41) (127) 67.7
Service charges 1,775 1,602 10.8
Card services 1,039 959 8.3
Insurance revenue, net of claims and related expenses1 1,113 1,167 (4.6)
Trust fees 149 154 (3.2)
Other income (loss) 322 558 (42.3)
Total $ 8,096 $ 8,001 1.2%
(millions of Canadian dollars) 2012 2011
Net interest income $ 1,050 $ 818
Trading income (loss) (41) (127)
Financial assets and liabilities designated
at fair value through profit or loss1 10 4
Total trading-related income (loss) $ 1,019 $ 695
By product
Interest rate and credit portfolios $ 534 $ 212
Foreign exchange portfolios 374 428
Equity and other portfolios 101 51
Financial assets and liabilities designated
at fair value through profit or loss1 10 4
Total trading-related income (loss) $ 1,019 $ 695
1 Excludes amounts related to securities designated at fair value through profit or
loss that are not managed within a trading portfolio, but which have been
combined with derivatives to form economic hedging relationships.
NON-INTEREST INCOME
TABLE 9
TRADING-RELATED INCOME
TABLE 10
1 The results of the Bank’s Insurance business within Wealth and Insurance include
both insurance revenue, net of claims and related expenses and the income from
investments that fund policy liabilities which are designated at fair value through
profit or loss within the Bank’s property and casualty insurance subsidiaries.
TRADING-RELATED INCOME
Trading-related income is the total of net interest income on trading
positions, trading income which includes income from trading loans,
and income from loans designated at fair value through profit or loss
that are managed within a trading portfolio. Trading-related income
increased by $324 million, or 47% from 2011. The increase was primar-
ily in interest rate and credit portfolios and equity and other portfolios,
partially offset by a decrease in foreign exchange compared to the prior
year. The trading environment for interest rate and credit trading
improved on tighter spreads and increased client activity in 2012.
The mix of trading-related income between net interest income and
trading income is largely dependent upon the level of interest rates,
which drives the funding costs of the Bank’s trading portfolios.
Generally, as interest rates rise, net interest income declines and trad-
ing income reported in non-interest income increases. Management
believes that the total trading-related income is the appropriate
measure of trading performance.
NON-INTEREST INCOME
Non-interest income for the year on a reported basis was $8,096 million,
an increase of $95 million, or 1%, compared with last year. Adjusted
non-interest income for the year was $8,189 million, an increase of
$317 million, or 4%, compared with last year. The increase in adjusted
non-interest income was primarily driven by increases in the Canadian
Personal and Commercial Banking and U.S. Personal and Commercial
Banking segments, partially offset by a decline in Wealth and
Insurance. Canadian Personal and Commercial Banking non-interest
income increased primarily due to higher transaction volumes, the
contribution from MBNA and fee repricing. U.S. Personal and
Commercial Banking non-interest income increased due to higher
fee-based revenue and gains on sales of securities, partially offset by
the impact of the Durbin Amendment and the anticipated run-off in
legacy Chrysler Financial revenue. Wealth and Insurance non-interest
income decreased primarily due to unfavourable prior years claims
development in the Ontario auto market and weather-related events
in the Insurance business and lower trading revenue in the Wealth
business, partially offset by strong premium growth and the inclusion
of MBNA in the Insurance business and higher fee-based revenue from
higher client assets in the Wealth business.