TD Bank 2012 Annual Report Download - page 11
Download and view the complete annual report
Please find page 11 of the 2012 TD Bank annual report below. You can navigate through the pages in the report by either clicking on the pages listed below, or by using the keyword search tool below to find specific information within the annual report.-
 1
1 -
 2
2 -
 3
3 -
 4
4 -
 5
5 -
 6
6 -
 7
7 -
 8
8 -
 9
9 -
 10
10 -
 11
11 -
 12
12 -
 13
13 -
 14
14 -
 15
15 -
 16
16 -
 17
17 -
 18
18 -
 19
19 -
 20
20 -
 21
21 -
 22
22 -
23
-
24
-
25
-
26
-
27
-
28
-
29
-
30
-
31
-
32
-
33
-
34
-
35
-
36
-
37
-
38
-
39
-
40
-
41
-
42
-
43
-
44
-
45
-
46
-
47
-
48
-
49
-
50
-
51
-
52
-
53
-
54
-
55
-
56
-
57
-
58
-
59
-
60
-
61
-
62
-
63
-
64
-
65
-
66
-
67
-
68
-
69
-
70
-
71
-
72
-
73
-
74
-
75
-
76
-
77
-
78
-
79
-
80
-
81
-
82
-
83
-
84
-
85
-
86
-
87
-
88
-
89
-
90
-
91
-
92
-
93
-
94
-
95
-
96
-
97
-
98
-
99
-
100
-
101
-
102
-
103
-
104
-
105
-
106
-
107
-
108
-
109
-
110
-
111
-
112
-
113
-
114
-
115
-
116
-
117
-
118
-
119
-
120
-
121
-
122
-
123
-
124
-
125
-
126
-
127
-
128
-
129
-
130
-
131
-
132
-
133
-
134
-
135
-
136
-
137
-
138
-
139
-
140
-
141
-
142
-
143
-
144
-
145
-
146
-
147
-
148
-
149
-
150
-
151
-
152
-
153
-
154
-
155
-
156
-
157
-
158
-
159
-
160
-
161
-
162
-
163
-
164
-
165
-
166
-
167
-
168
-
169
-
170
-
171
-
172
-
173
-
174
-
175
-
176
-
177
-
178
-
179
-
180
-
181
-
182
-
183
-
184
-
185
-
186
-
187
-
188
-
189
-
190
-
191
-
192
-
193
-
194
-
195
-
196
 |
 |

TD BANK GROUP ANNUAL REPORT 2012 MANAGEMENT’S DISCUSSION AND ANALYSIS 9
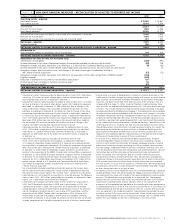
NON-GAAP FINANCIAL MEASURES – RECONCILIATION OF ADJUSTED TO REPORTED NET INCOME
TABLE 2
(millions of Canadian dollars) 2012 2011
Operating results – adjusted
Net interest income1 $ 15,062 $ 13,661
Non-interest income2 8,191 7,874
Total revenue 23,253 21,535
Provision for credit losses3 1,903 1,490
Non-interest expenses4 13,162 12,373
Income before income taxes and equity in net income of an investment in associate 8,188 7,672
Provision for income taxes5 1,404 1,545
Equity in net income of an investment in associate, net of income taxes6 291 305
Net income – adjusted 7,075 6,432
Preferred dividends 196 180
Net income available to common shareholders and non-controlling interests in subsidiaries – adjusted 6,879 6,252
Attributable to:
Non-controlling interests in subsidiaries, net of income taxes 104 104
Net income available to common shareholders – adjusted 6,775 6,148
Adjustments for items of note, net of income taxes
Amortization of intangibles7 (238) (391)
Increase (decrease) in fair value of derivatives hedging the reclassified available-for-sale securities portfolio8 (89) 128
Integration charges and direct transaction costs relating to U.S. Personal and Commercial Banking acquisitions9 (9) (82)
Increase (decrease) in fair value of credit default swaps hedging the corporate loan book, net of provision for credit losses10 – 13
Integration charges, direct transaction costs, and changes in fair value of contingent consideration relating to
the Chrysler Financial acquisition11 (17) (55)
Integration charges and direct transaction costs relating to the acquisition of the credit card portfolio of MBNA Canada12 (104) –
Litigation reserve13 (248) –
Reduction of allowance for incurred but not identified credit losses14 120 –
Positive impact due to changes in statutory income tax rates15 18 –
Impact of Superstorm Sandy16 (37) –
Total adjustments for items of note (604) (387)
Net income available to common shareholders – reported $ 6,171 $ 5,761
1 Adjusted net interest income excludes the following items of note: 2012 – $36 million
(net of tax, $27 million) of certain charges against revenue related to promotional-
rate card origination activities, as explained in footnote 12.
2
Adjusted non-interest income excludes the following items of note: 2012 – $2 million
loss due to change in fair value of credit default swaps (CDS) hedging the corporate
loan book, as explained in footnote 10; $89 million loss due to change in fair
value of derivatives hedging the reclassified available-for-sale (AFS) securities
portfolio, as explained in footnote 8; $3 million loss due to change in fair value
of contingent consideration relating to Chrysler Financial, as explained in footnote 11,
$1 million loss due to the impact of Superstorm Sandy, as explained
in footnote 16;
2011 – $19 million gain due to change in fair value of CDS hedging the corporate
loan book; $158 million gain due to change in fair value of derivatives hedging
the reclassified AFS securities portfolio; $50 million loss due to change in fair
value of contingent consideration relating to Chrysler Financial.
3 Adjusted provision for credit losses (PCL) excludes the following items of note:
2012 – $162 million in adjustments to allowance for incurred but not identified
credit losses in Canadian Personal and Commercial Banking, as explained in
footnote 14; $54 million due to the impact of Superstorm Sandy, as explained
in footnote 16.
4
Adjusted non-interest expenses excludes the following items of note:
2012 – $277 million
amortization of intangibles, as explained in footnote 7;
$11 million of integration charges related to U.S. Personal and Commercial Bank-
ing acquisitions, as explained in footnote 9; $24 million of integration charges and
direct transaction costs relating to the Chrysler Financial acquisition, as explained
in footnote 11; $104 million of integration charges and direct transaction costs
relating to the acquisition of the MBNA Canada credit card portfolio, as explained
in footnote 12; $413 million of charges related to a litigation reserve, as explained
in footnote 13; $7 million due to the impact of Superstorm Sandy, as explained in
footnote 16; 2011 – $496 million amortization of intangibles; $141 million of inte-
gration charges related to U.S. Personal and Commercial Banking acquisitions;
$37 million of integration charges and direct transaction costs relating to the
Chrysler Financial acquisition.
5 For a reconciliation between reported and adjusted provision for income taxes,
see the ‘Non-GAAP Financial Measures – Reconciliation of Reported to Adjusted
Provision for Income Taxes’ table in the “Income Taxes” section of this document.
6 Adjusted equity in net income of an investment in associate excludes the following
items of note: 2012 – $57 million amortization of intangibles, as explained in foot-
note 7; 2011 – $59 million amortization of intangibles.
7 Amortization of intangibles primarily relates to the Canada Trust acquisition in
2000, the TD Banknorth acquisition in 2005 and its privatization in 2007, the
Commerce acquisition in 2008, the acquisitions by TD Banknorth of Hudson
United Bancorp in 2006 and Interchange Financial Services in 2007, the amortiza-
tion of intangibles included in equity in net income of TD Ameritrade, and the
acquisition of the MBNA Canada credit card portfolio in 2012. Effective 2011,
amortization of software is recorded in amortization of intangibles; however,
amortization of software is not included for purposes of items of note, which only
includes amortization of intangibles acquired as a result of business combinations.
8 During 2008, as a result of deterioration in markets and severe dislocation in the
credit market, the Bank changed its trading strategy with respect to certain trading
debt securities. Since the Bank no longer intended to actively trade in these debt
securities, the Bank reclassified these debt securities from trading to the AFS
category effective August 1, 2008. As part of the Bank’s trading strategy, these
debt securities are economically hedged, primarily with CDS and interest rate swap
contracts. This includes foreign exchange translation exposure related to the debt
securities portfolio and the derivatives hedging it. These derivatives are not eligible
for reclassification and are recorded on a fair value basis with changes in fair value
recorded in the period’s earnings. Management believes that this asymmetry in the
accounting treatment between derivatives and the reclassified debt securities results
in volatility in earnings from period to period that is not indicative of the economics
of the underlying business performance in Wholesale Banking. Commencing in the
second quarter of 2011, the Bank may from time to time replace securities within
the portfolio to best utilize the initial, matched fixed term funding. As a result, the
derivatives are accounted for on an accrual basis in Wholesale Banking and the
gains and losses related to the derivatives in excess of the accrued amounts are
reported in the Corporate segment. Adjusted results of the Bank exclude the gains
and losses of the derivatives in excess of the accrued amount.
9 As a result of U.S. Personal and Commercial Banking acquisitions, the Bank
incurred integration charges and direct transaction costs. Integration charges
consist of costs related to information technology, employee retention, external
professional consulting charges, marketing (including customer communication
and rebranding), integration-related travel costs, employee severance costs, the
costs of amending certain executive employment and award agreements, contract
termination fees and the write-down of long-lived assets due to impairment.
Direct transaction costs are expenses directly incurred in effecting a business
combination and consist primarily of finders’ fees, advisory fees, and legal fees.
Integration charges in the recent quarters were driven by the South Financial and
FDIC-assisted acquisitions and there were no direct transaction costs recorded.
The first quarter 2012 was the last quarter U.S. Personal and Commercial Banking
included any further FDIC-assisted and South Financial related integration charges
or direct transaction costs as an item of note.
10 The Bank purchases CDS to hedge the credit risk in Wholesale Banking’s corporate
lending portfolio. These CDS do not qualify for hedge accounting treatment and
are measured at fair value with changes in fair value recognized in current period’s
earnings. The related loans are accounted for at amortized cost. Management
believes that this asymmetry in the accounting treatment between CDS and loans
would result in periodic profit and loss volatility which is not indicative of the
economics of the corporate loan portfolio or the underlying business performance
in Wholesale Banking. As a result, the CDS are accounted for on an accrual basis in
Wholesale Banking and the gains and losses on the CDS, in excess of the accrued
cost, are reported in the Corporate segment. Adjusted earnings exclude the gains
and losses on the CDS in excess of the accrued cost. When a credit event occurs in
the corporate loan book that has an associated CDS hedge, the PCL related to the
portion that was hedged via the CDS is netted against this item of note.