TD Bank 2012 Annual Report Download - page 10
Download and view the complete annual report
Please find page 10 of the 2012 TD Bank annual report below. You can navigate through the pages in the report by either clicking on the pages listed below, or by using the keyword search tool below to find specific information within the annual report.-
 1
1 -
 2
2 -
 3
3 -
 4
4 -
 5
5 -
 6
6 -
 7
7 -
 8
8 -
 9
9 -
 10
10 -
 11
11 -
 12
12 -
 13
13 -
 14
14 -
 15
15 -
 16
16 -
 17
17 -
 18
18 -
 19
19 -
 20
20 -
 21
21 -
22
-
23
-
24
-
25
-
26
-
27
-
28
-
29
-
30
-
31
-
32
-
33
-
34
-
35
-
36
-
37
-
38
-
39
-
40
-
41
-
42
-
43
-
44
-
45
-
46
-
47
-
48
-
49
-
50
-
51
-
52
-
53
-
54
-
55
-
56
-
57
-
58
-
59
-
60
-
61
-
62
-
63
-
64
-
65
-
66
-
67
-
68
-
69
-
70
-
71
-
72
-
73
-
74
-
75
-
76
-
77
-
78
-
79
-
80
-
81
-
82
-
83
-
84
-
85
-
86
-
87
-
88
-
89
-
90
-
91
-
92
-
93
-
94
-
95
-
96
-
97
-
98
-
99
-
100
-
101
-
102
-
103
-
104
-
105
-
106
-
107
-
108
-
109
-
110
-
111
-
112
-
113
-
114
-
115
-
116
-
117
-
118
-
119
-
120
-
121
-
122
-
123
-
124
-
125
-
126
-
127
-
128
-
129
-
130
-
131
-
132
-
133
-
134
-
135
-
136
-
137
-
138
-
139
-
140
-
141
-
142
-
143
-
144
-
145
-
146
-
147
-
148
-
149
-
150
-
151
-
152
-
153
-
154
-
155
-
156
-
157
-
158
-
159
-
160
-
161
-
162
-
163
-
164
-
165
-
166
-
167
-
168
-
169
-
170
-
171
-
172
-
173
-
174
-
175
-
176
-
177
-
178
-
179
-
180
-
181
-
182
-
183
-
184
-
185
-
186
-
187
-
188
-
189
-
190
-
191
-
192
-
193
-
194
-
195
-
196
 |
 |

TD BANK GROUP ANNUAL REPORT 2012 MANAGEMENT’S DISCUSSION AND ANALYSIS8
that adjusted results provide the reader with a better understanding
of how management views the Bank’s performance. The items of note
are listed in the table on the following page. As explained, adjusted
results are different from reported results determined in accordance
with IFRS. Adjusted results, items of note, and related terms used in
this document are not defined terms under IFRS and, therefore, may
not be comparable to similar terms used by other issuers.
The Bank transitioned from Canadian GAAP to IFRS, beginning in
the first quarter of fiscal 2012. Refer to Note 38 of the Consolidated
Financial Statements for the Bank’s IFRS opening Consolidated Balance
Sheet as at November 1, 2010 (IFRS opening Consolidated Balance
Sheet) and related disclosures including a summary of the Bank’s first-
time adoption transition elections under IFRS 1 and other significant
differences between Canadian GAAP and IFRS. These disclosures form
the starting point for TD’s financial reporting under IFRS and have
been provided to allow users of the financial statements to obtain
a better understanding of the expected effect on the Consolidated
Financial Statements as a result of the adoption of IFRS. The annual
fiscal 2012 Consolidated Financial Statements also include fiscal 2011
comparatives, related transitional reconciliations, and accompanying
note disclosures.
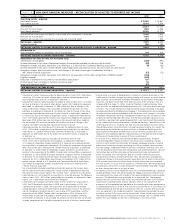
The following table provides the operating results – reported for the Bank.
FINANCIAL RESULTS OVERVIEW
CORPORATE OVERVIEW
The Toronto-Dominion Bank and its subsidiaries are collectively known
as TD Bank Group (TD or the Bank). TD is the sixth largest bank in North
America by branches and serves approximately 22 million customers in
four key businesses operating in a number of locations in key financial
centres around the globe: Canadian Personal and Commercial Banking,
Wealth and Insurance, U.S. Personal and Commercial Banking, and
Wholesale Banking. TD also ranks among the world’s leading online
financial services firms, with more than 8.5 million online customers.
TD had $811 billion in assets on October 31, 2012. The Toronto-
Dominion Bank trades under the symbol “TD” on the Toronto and
New York Stock Exchanges.
HOW THE BANK REPORTS
The Bank prepares its Consolidated Financial Statements in accordance
with generally accepted accounting principles (GAAP) under IFRS and
refers to results prepared in accordance with IFRS as “reported”
results. The Bank also utilizes non-GAAP financial measures to arrive at
“adjusted” results to assess each of its businesses and to measure
overall Bank performance. To arrive at adjusted results, the Bank
removes “items of note,” net of income taxes, from reported results.
The items of note relate to items which management does not believe
are indicative of underlying business performance. The Bank believes
OPERATING RESULTS – REPORTED
TABLE 1
(millions of Canadian dollars) 2012 2011
Net interest income $ 15,026 $ 13,661
Non-interest income 8,096 8,001
Total revenue 23,122 21,662
Provision for credit losses 1,795 1,490
Non-interest expenses 13,998 13,047
Income before income taxes and equity in net income of an investment in associate 7,329 7,125
Provision for income taxes 1,092 1,326
Equity in net income of an investment in associate, net of income taxes 234 246
Net income – reported 6,471 6,045
Preferred dividends 196 180
Net income available to common shareholders and non-controlling interests in subsidiaries $ 6,275 $ 5,865
Attributable to:
Non-controlling interests $ 104 $ 104
Common shareholders $ 6,171 $ 5,761