TD Bank 2003 Annual Report Download - page 4
Download and view the complete annual report
Please find page 4 of the 2003 TD Bank annual report below. You can navigate through the pages in the report by either clicking on the pages listed below, or by using the keyword search tool below to find specific information within the annual report.-
 1
1 -
 2
2 -
 3
3 -
 4
4 -
 5
5 -
 6
6 -
 7
7 -
 8
8 -
 9
9 -
 10
10 -
 11
11 -
 12
12 -
 13
13 -
 14
14 -
 15
15 -
16
-
17
-
18
-
19
-
20
-
21
-
22
-
23
-
24
-
25
-
26
-
27
-
28
-
29
-
30
-
31
-
32
-
33
-
34
-
35
-
36
-
37
-
38
-
39
-
40
-
41
-
42
-
43
-
44
-
45
-
46
-
47
-
48
-
49
-
50
-
51
-
52
-
53
-
54
-
55
-
56
-
57
-
58
-
59
-
60
-
61
-
62
-
63
-
64
-
65
-
66
-
67
-
68
-
69
-
70
-
71
-
72
-
73
-
74
-
75
-
76
-
77
-
78
-
79
-
80
-
81
-
82
-
83
-
84
-
85
-
86
-
87
-
88
-
89
-
90
-
91
-
92
-
93
-
94
-
95
-
96
-
97
-
98
-
99
-
100
-
101
-
102
-
103
-
104
-
105
-
106
-
107
-
108
 |
 |

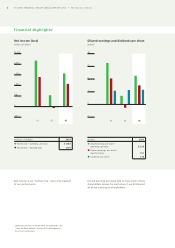
Net income is our “bottom line” and a key measure
of our performance.
Diluted earnings per share tells us how much money
shareholders receive for each share if we distributed
all of our earnings to shareholders.
Financial Highlights1
TD BANK FINANCIAL GROUP ANNUAL REPORT 2003 • The Year at a Glance2
Net income (loss)
(millions of dollars)
01 02 03
$2,500
2,000
1,500
1,000
500
0
-500
Diluted earnings and dividends per share
(dollars)
$4
3
2
0
1
-1
01 02 03
(millions of dollars) 2003
Net income – operating cash basis $ 1,567
Net income – reported basis 1,076
(dollars) 2003
Diluted earnings per share –
operating cash basis $ 2.26
Diluted earnings per share –
reported basis 1.51
Dividends per share 1.16
1 Operating cash basis measurements are explained in the
“How the Bank Reports” section of the Management's
Discussion and Analysis.